
Capabilities
Design
Product design; usability; interaction design; information architecture; design systems; complex workflows and data-heavy interfaces
Research
Usability testing; heuristic evaluation; user interviews; stakeholder interviews; journey mapping; continuous discovery; design validation
Product
Product strategy; roadmap collaboration; requirements clarification; cross-functional delivery; developer handoff; Agile/Scrum
Tools
Figma; Claude Design; Claude Code; Cursor; V0; Codex; Supabase
Contact
monaiu.icy@gmail.com
Hong Kong — English, Cantonese, Mandarin
Recent projects
2026
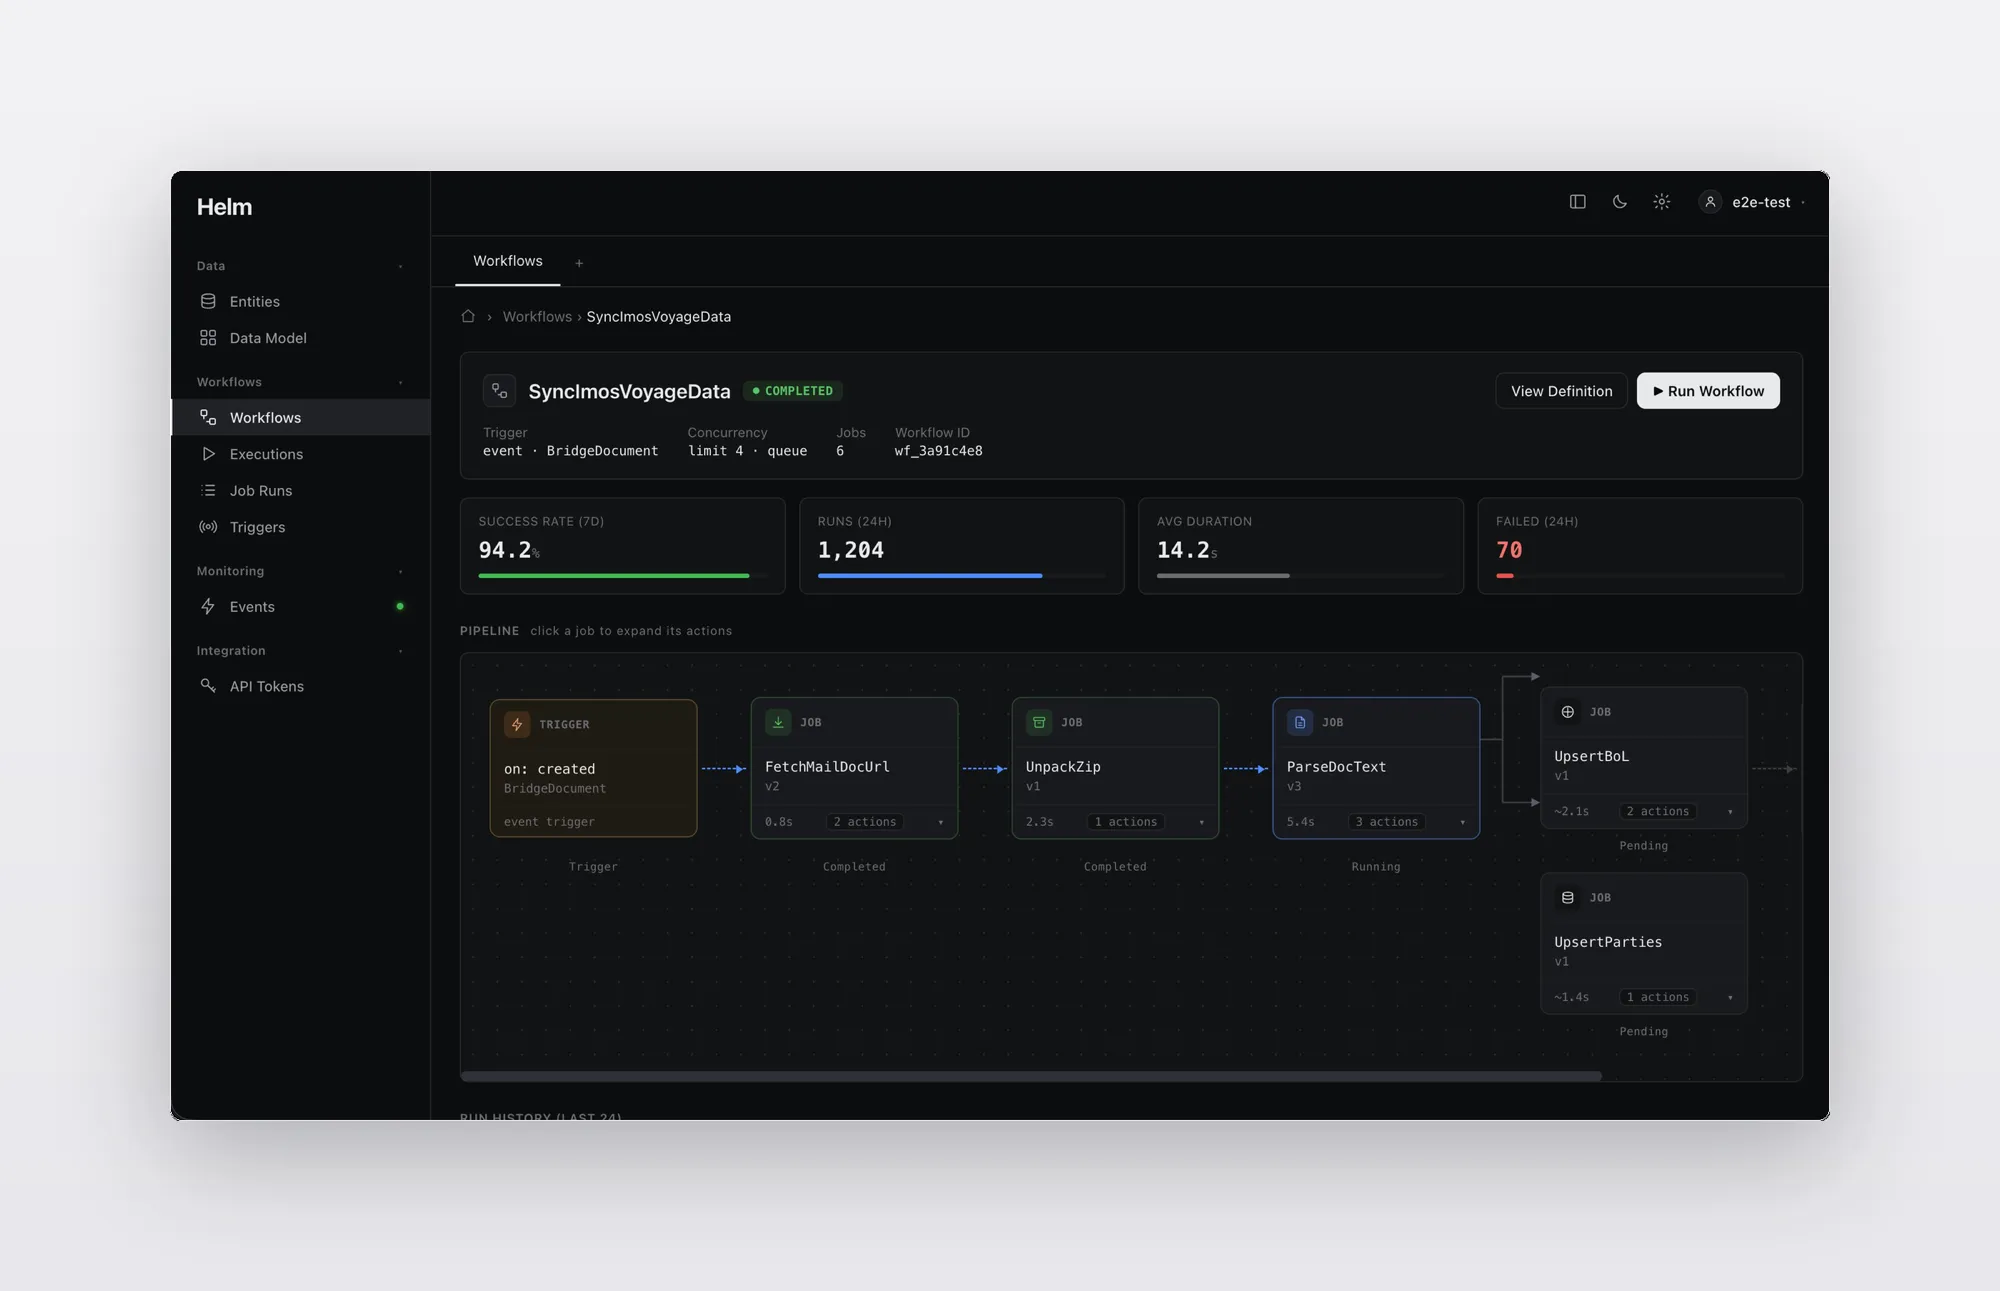
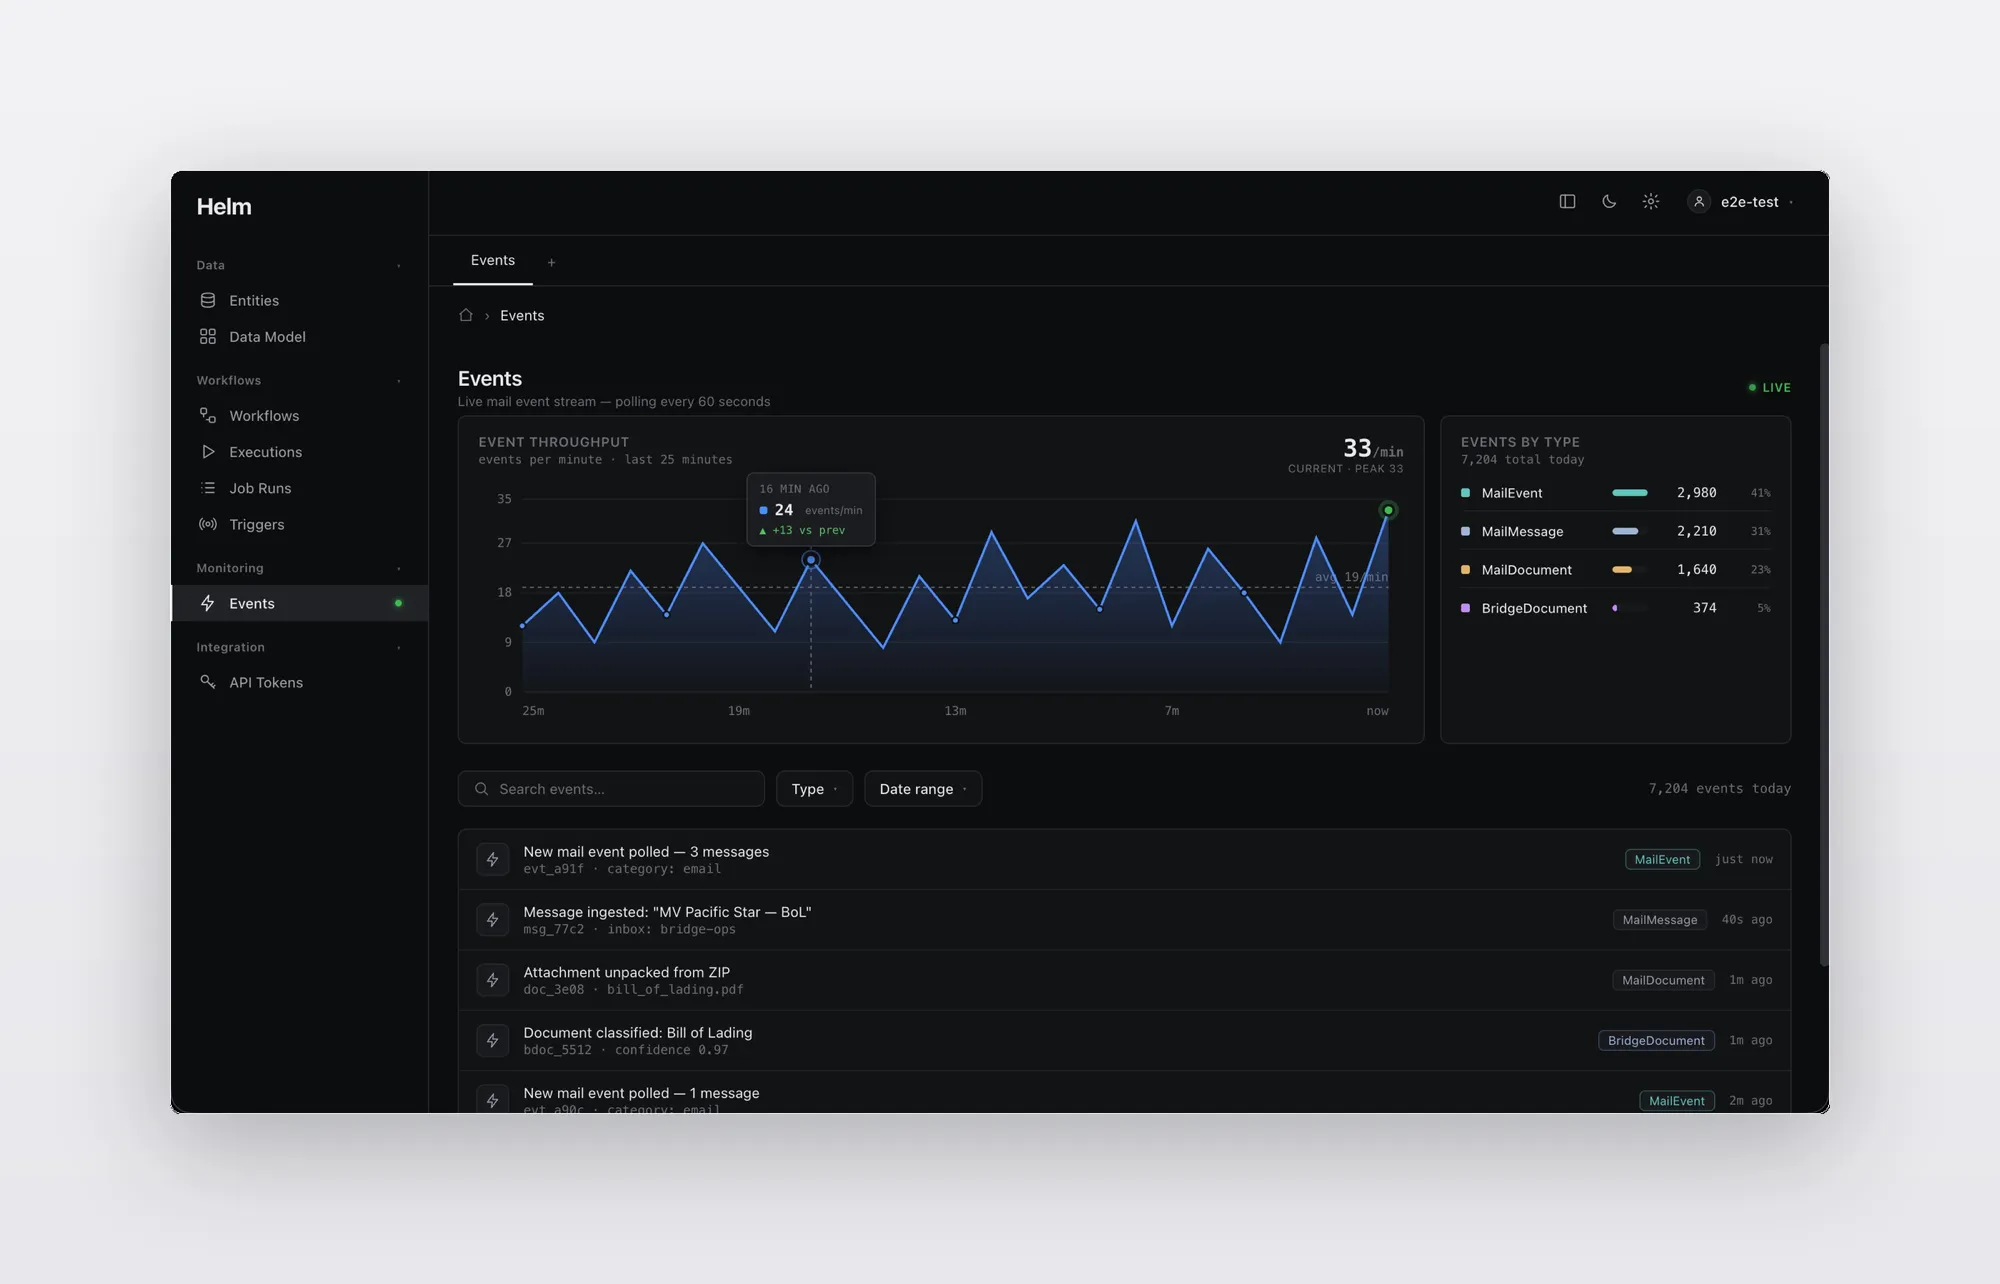
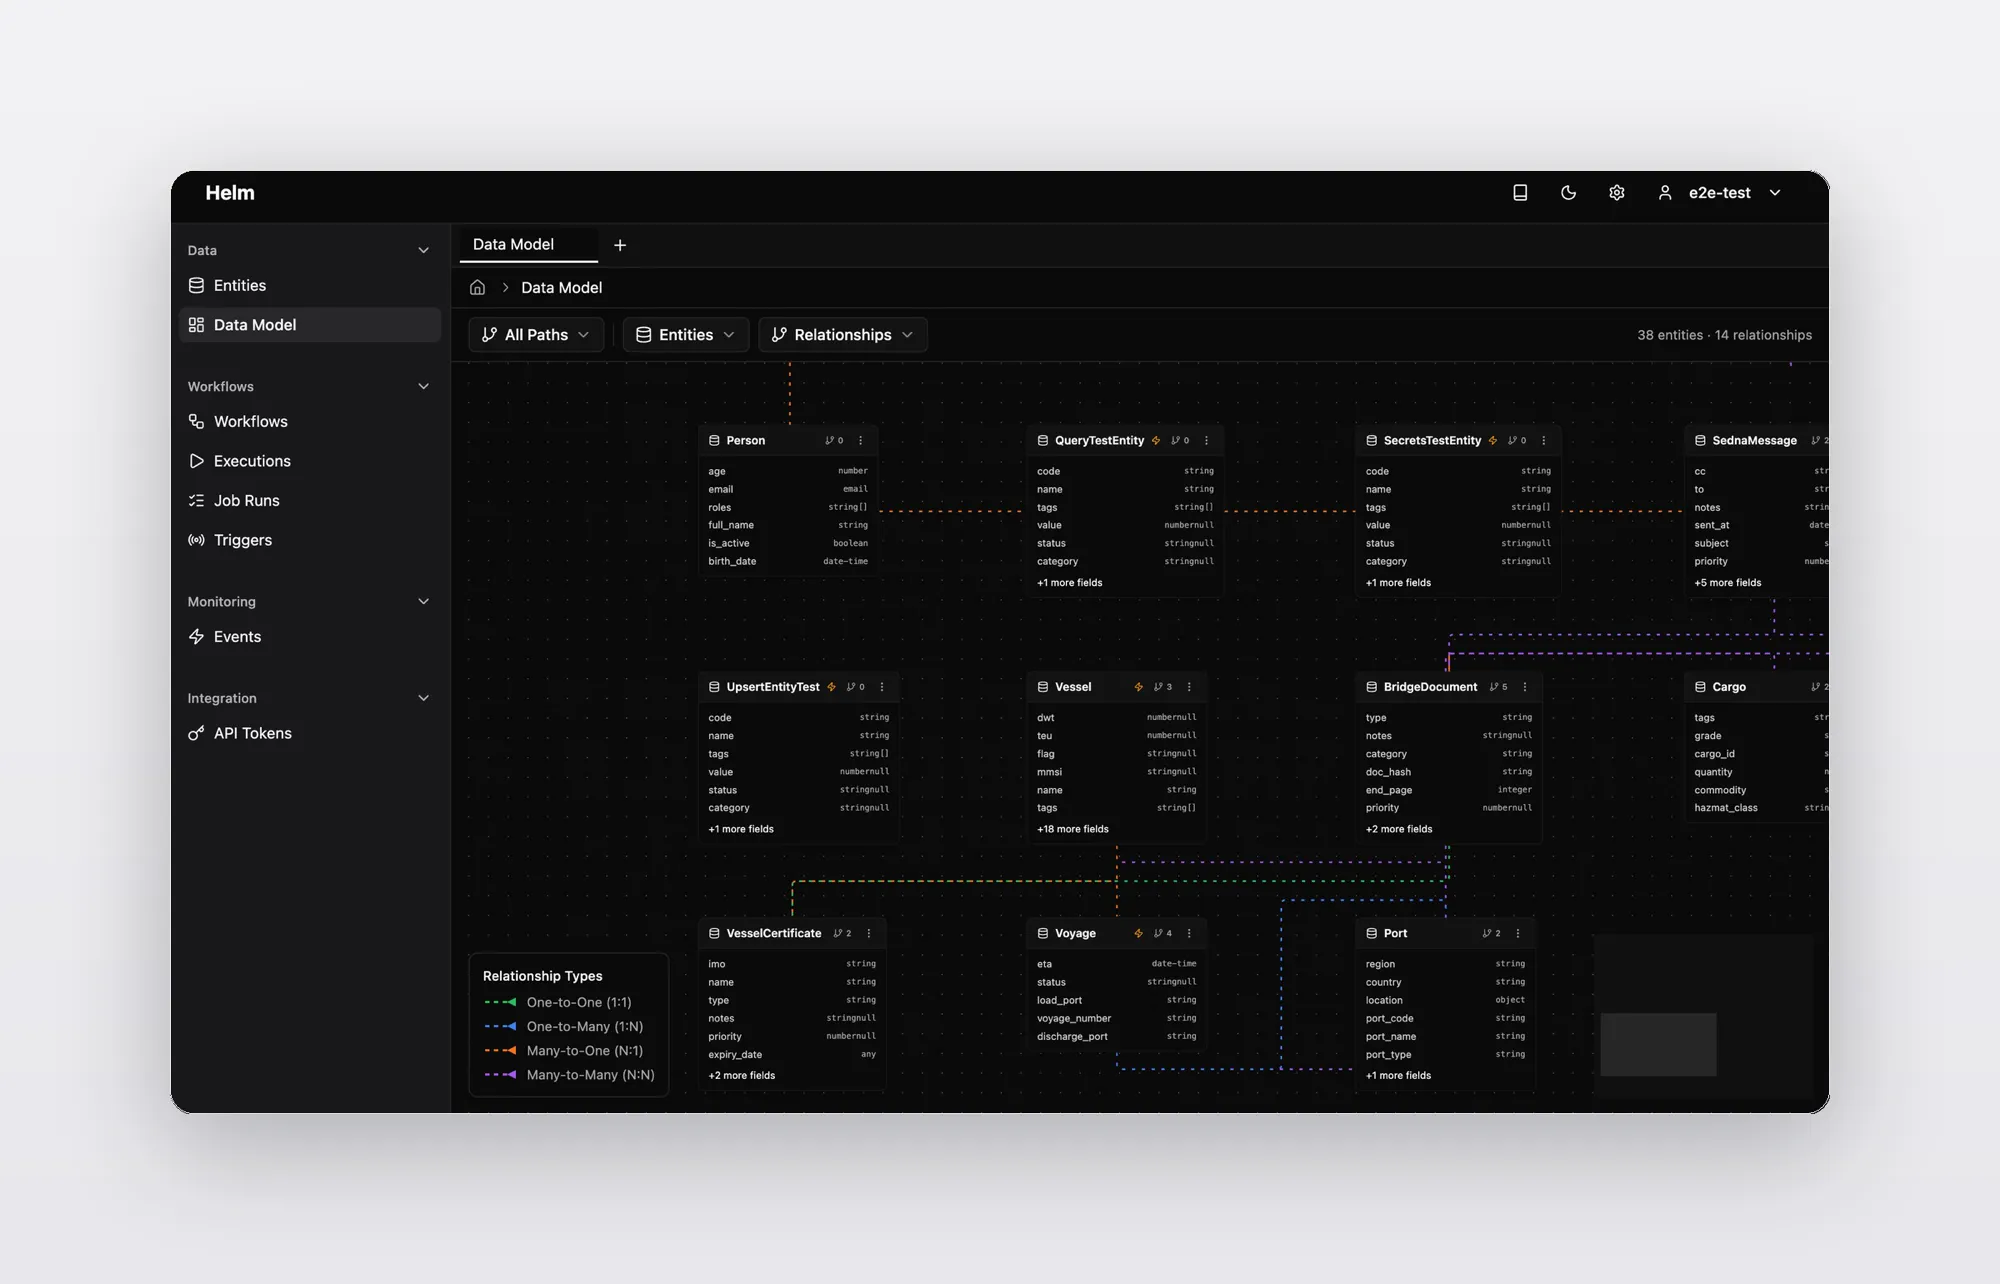
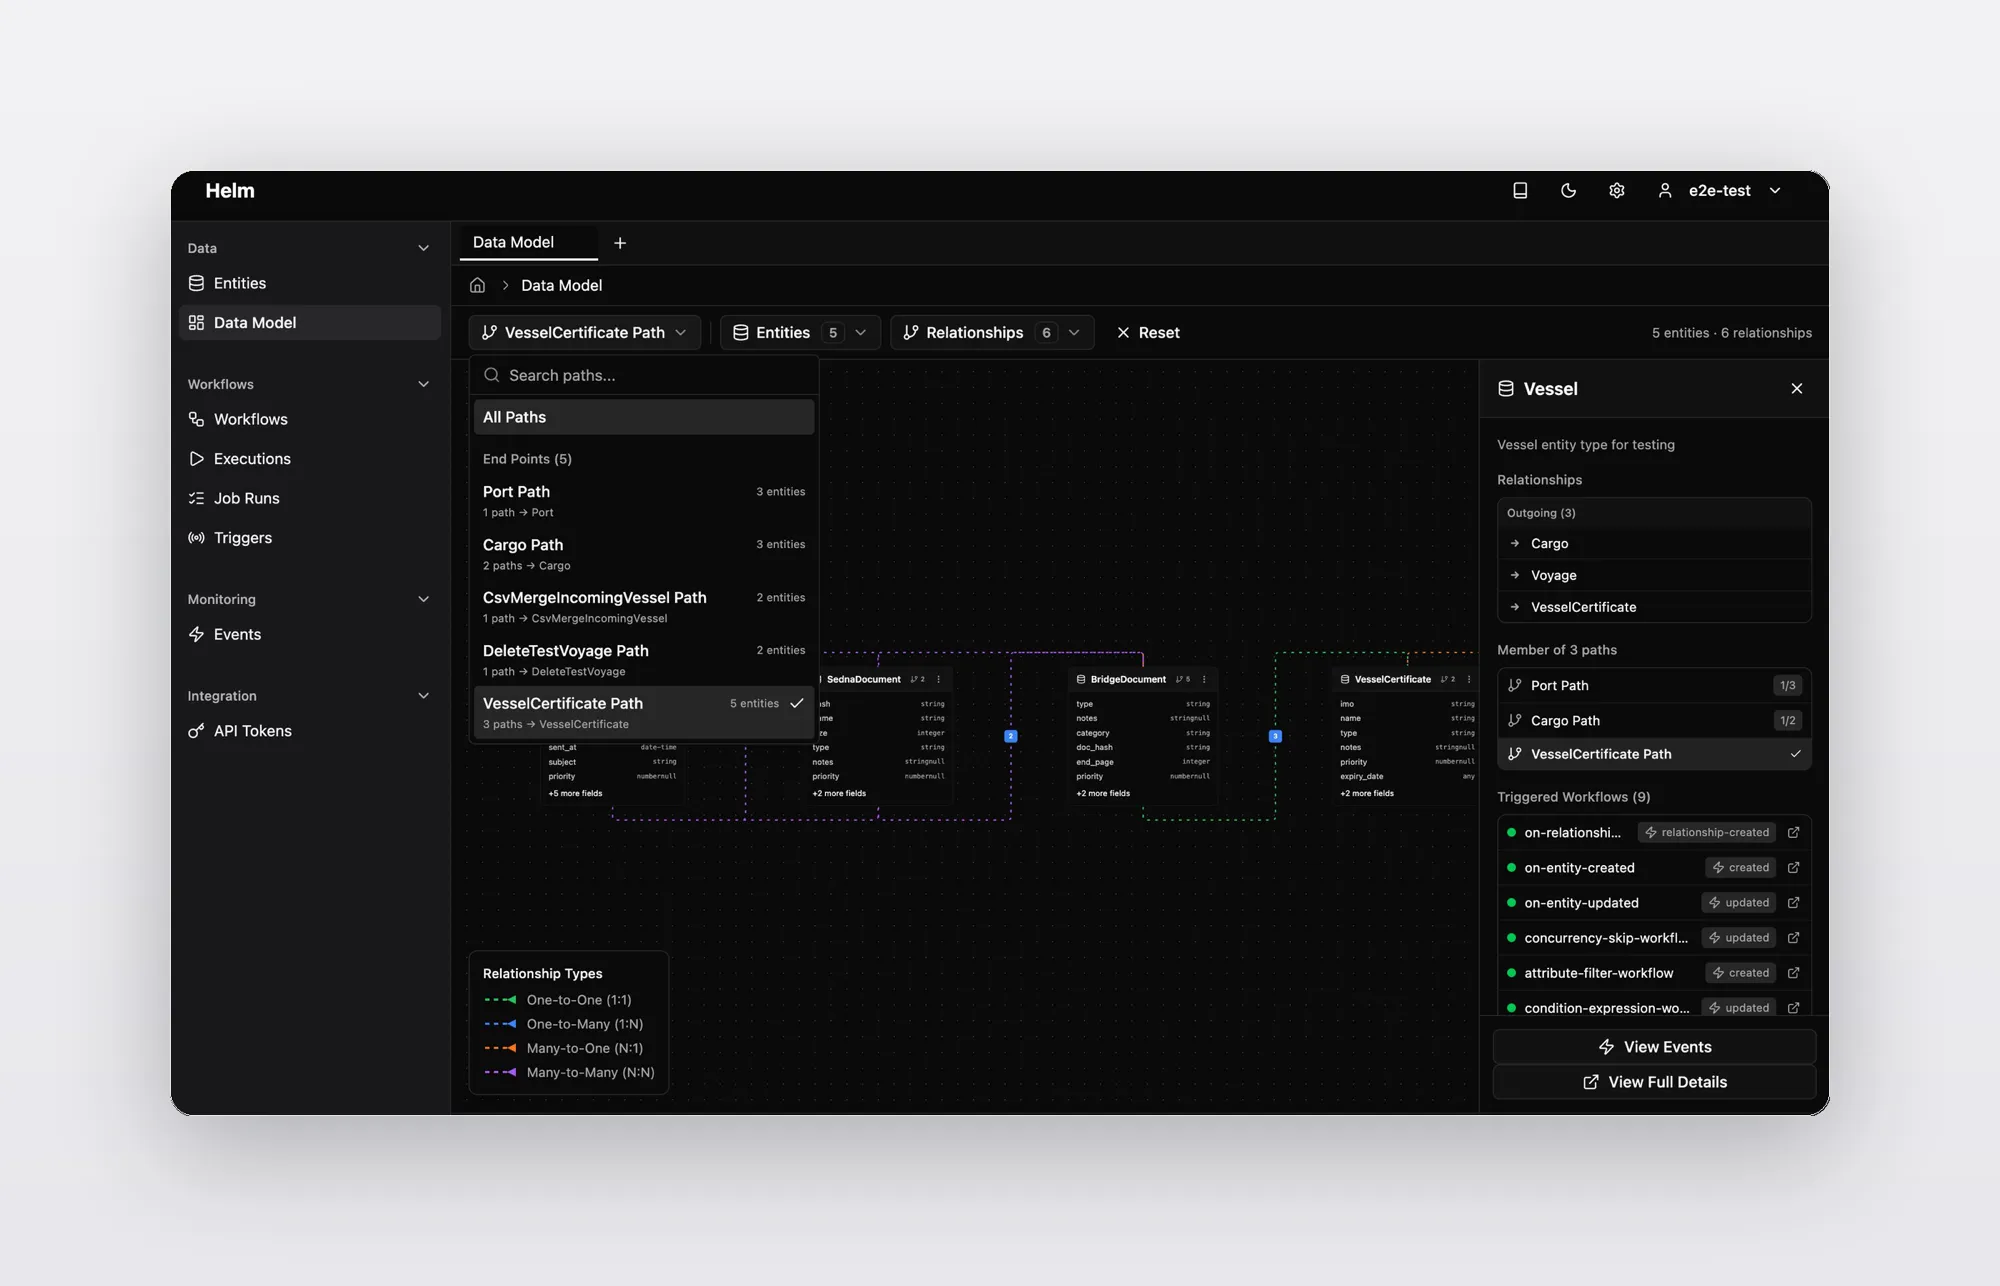
Helm (Laburnum Consulting). Operations dashboard for a multi-tenant maritime data platform with complex entity types, relationship rules, and automated workflows.
About
B2B / Maritime / Internal Tooling / Multi-tenant
Users
Maritime ops analysts, data managers, tenant admins
Tools
Figma, Claude Code, Cursor, Supabase
Role
Design Engineer, Contract
Scope
•
Vibe-coded the production frontend — entities, data model explorer, workflows, event streams, query builder, auth and multi-tenant admin
•
Built a column-builder system for 15+ tables with composable types, establishing the design system foundation
•
Designed permission-gated progressive disclosure so the UI degrades gracefully per role
•
Added entity querying with filtering, sorting, and CSV import/export for working with data at scale
•
Ran usability walkthroughs with stakeholders to simplify multi-step workflows
2026
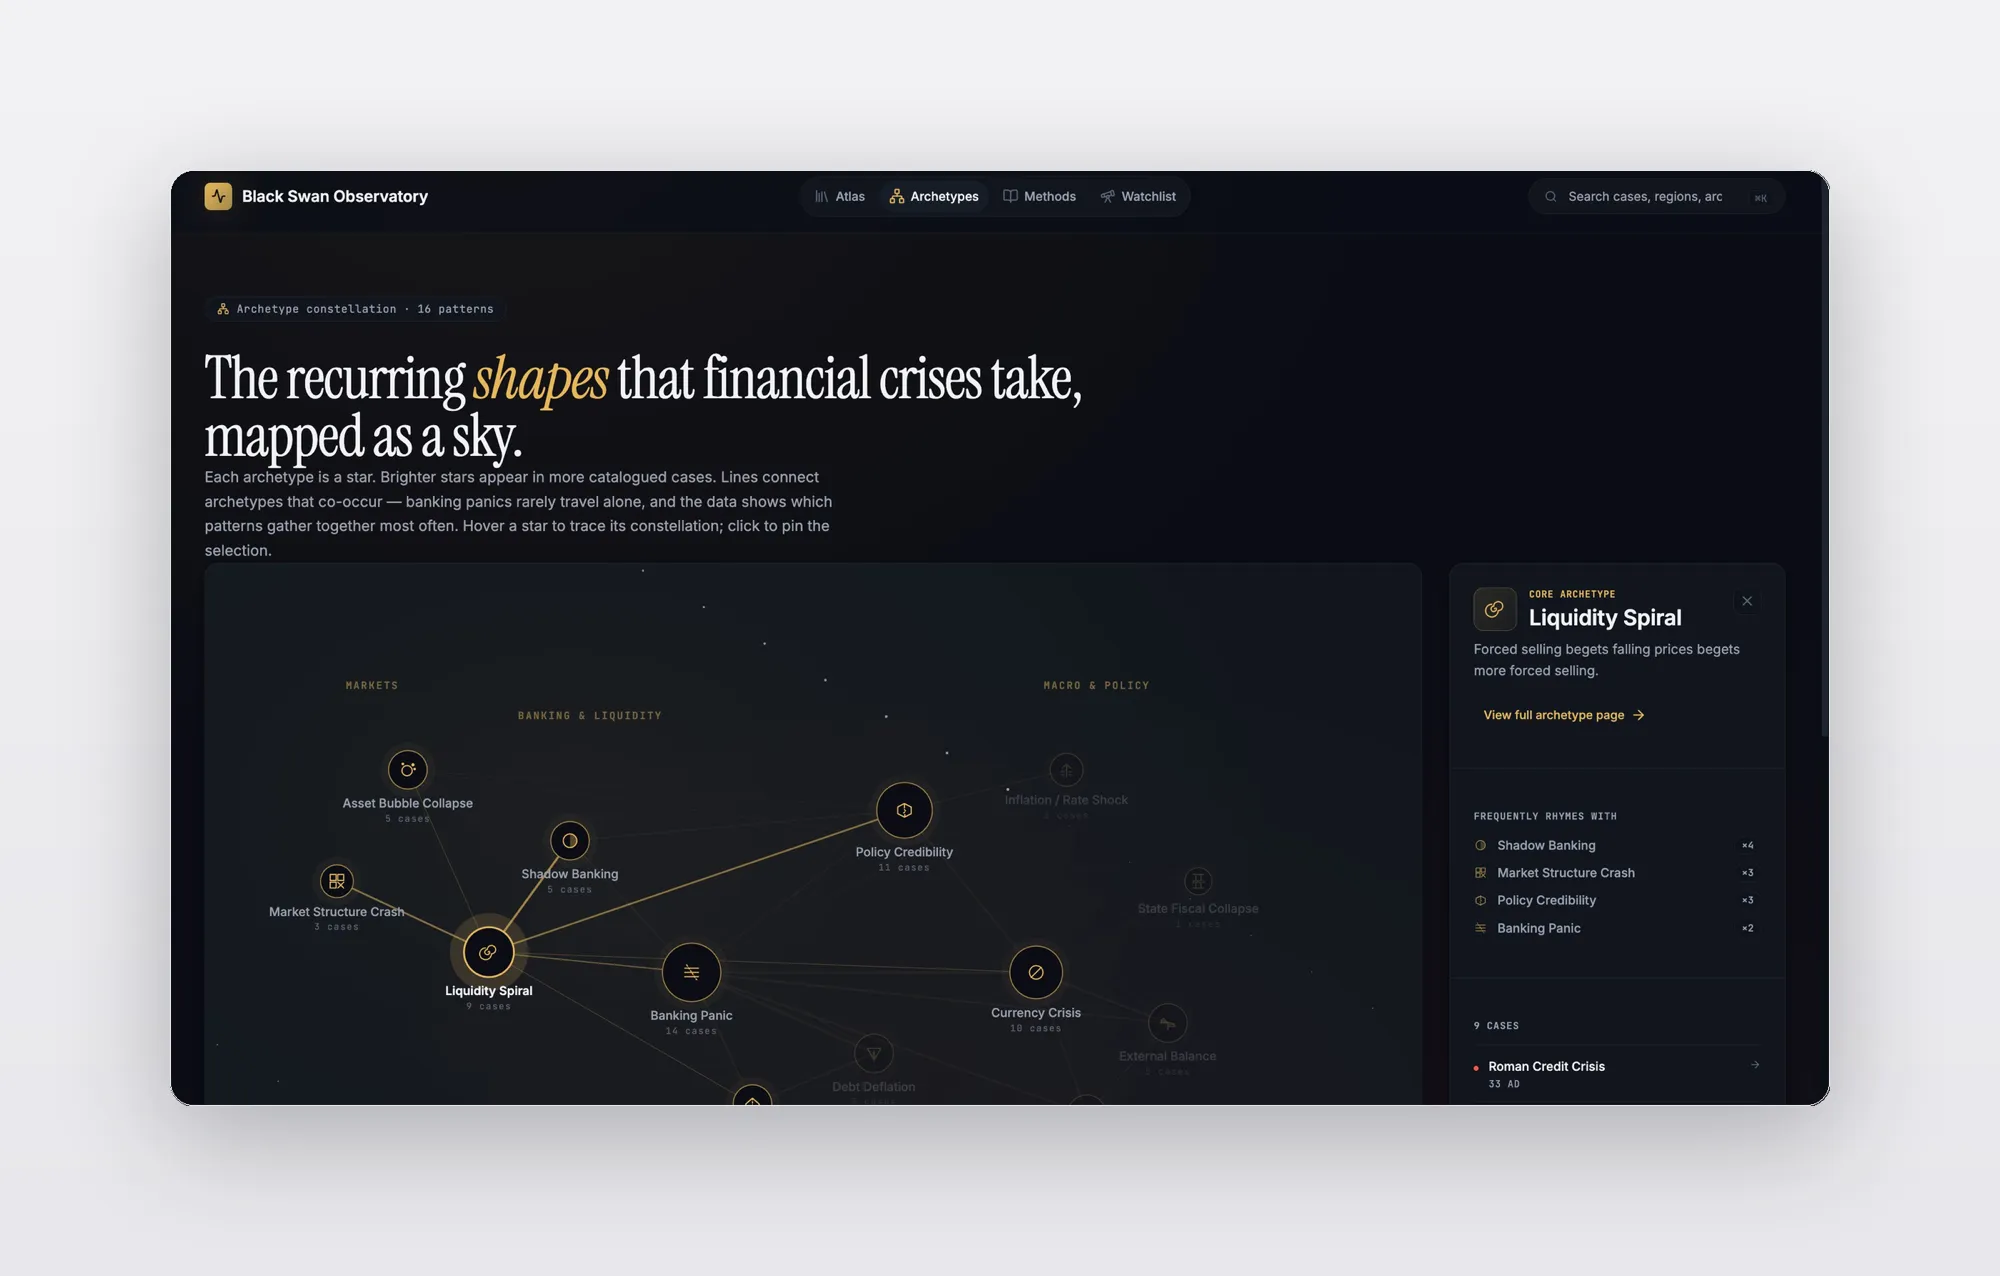
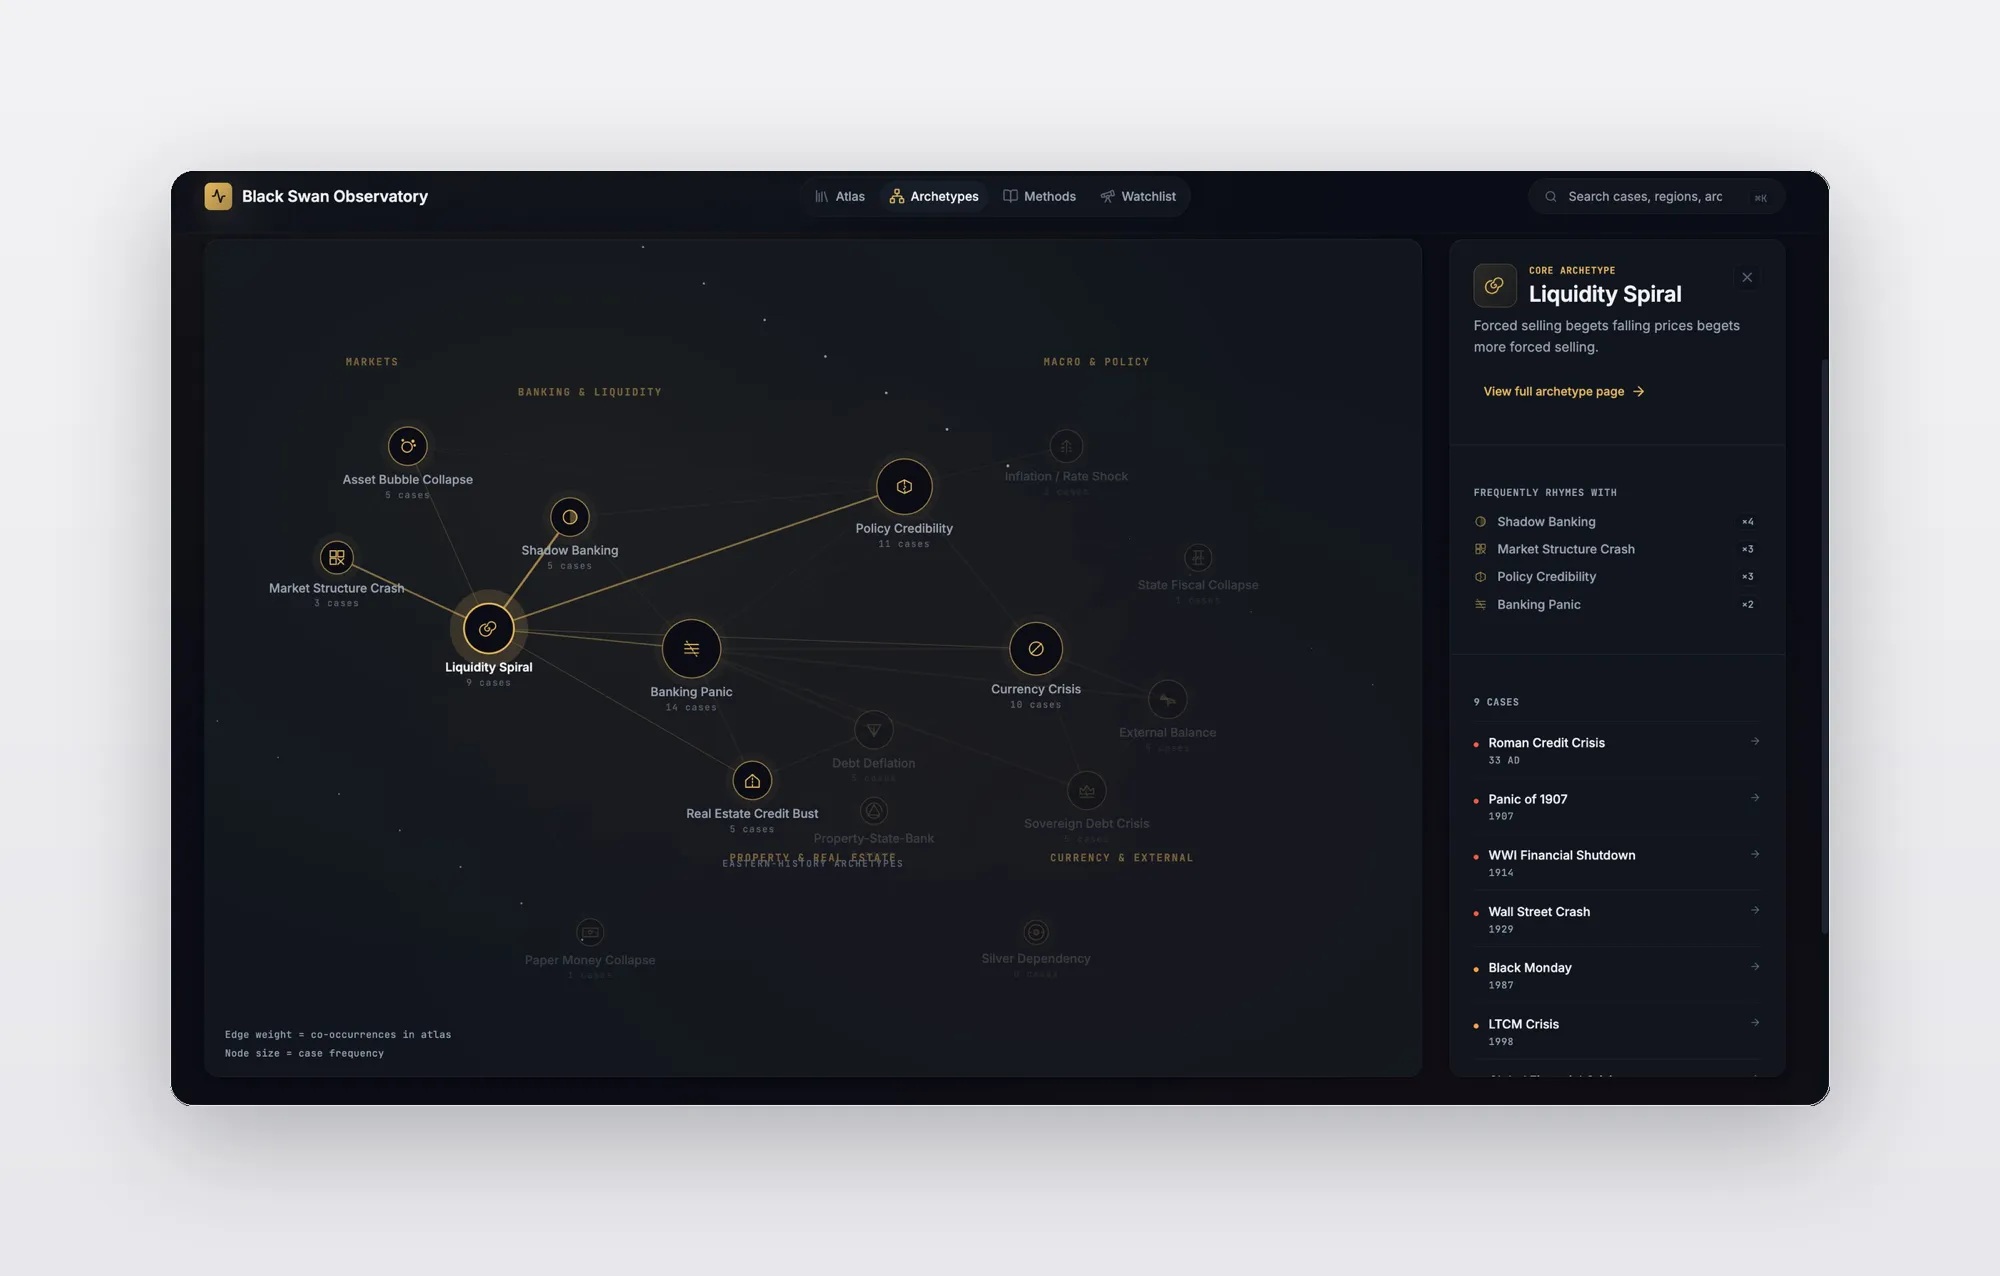
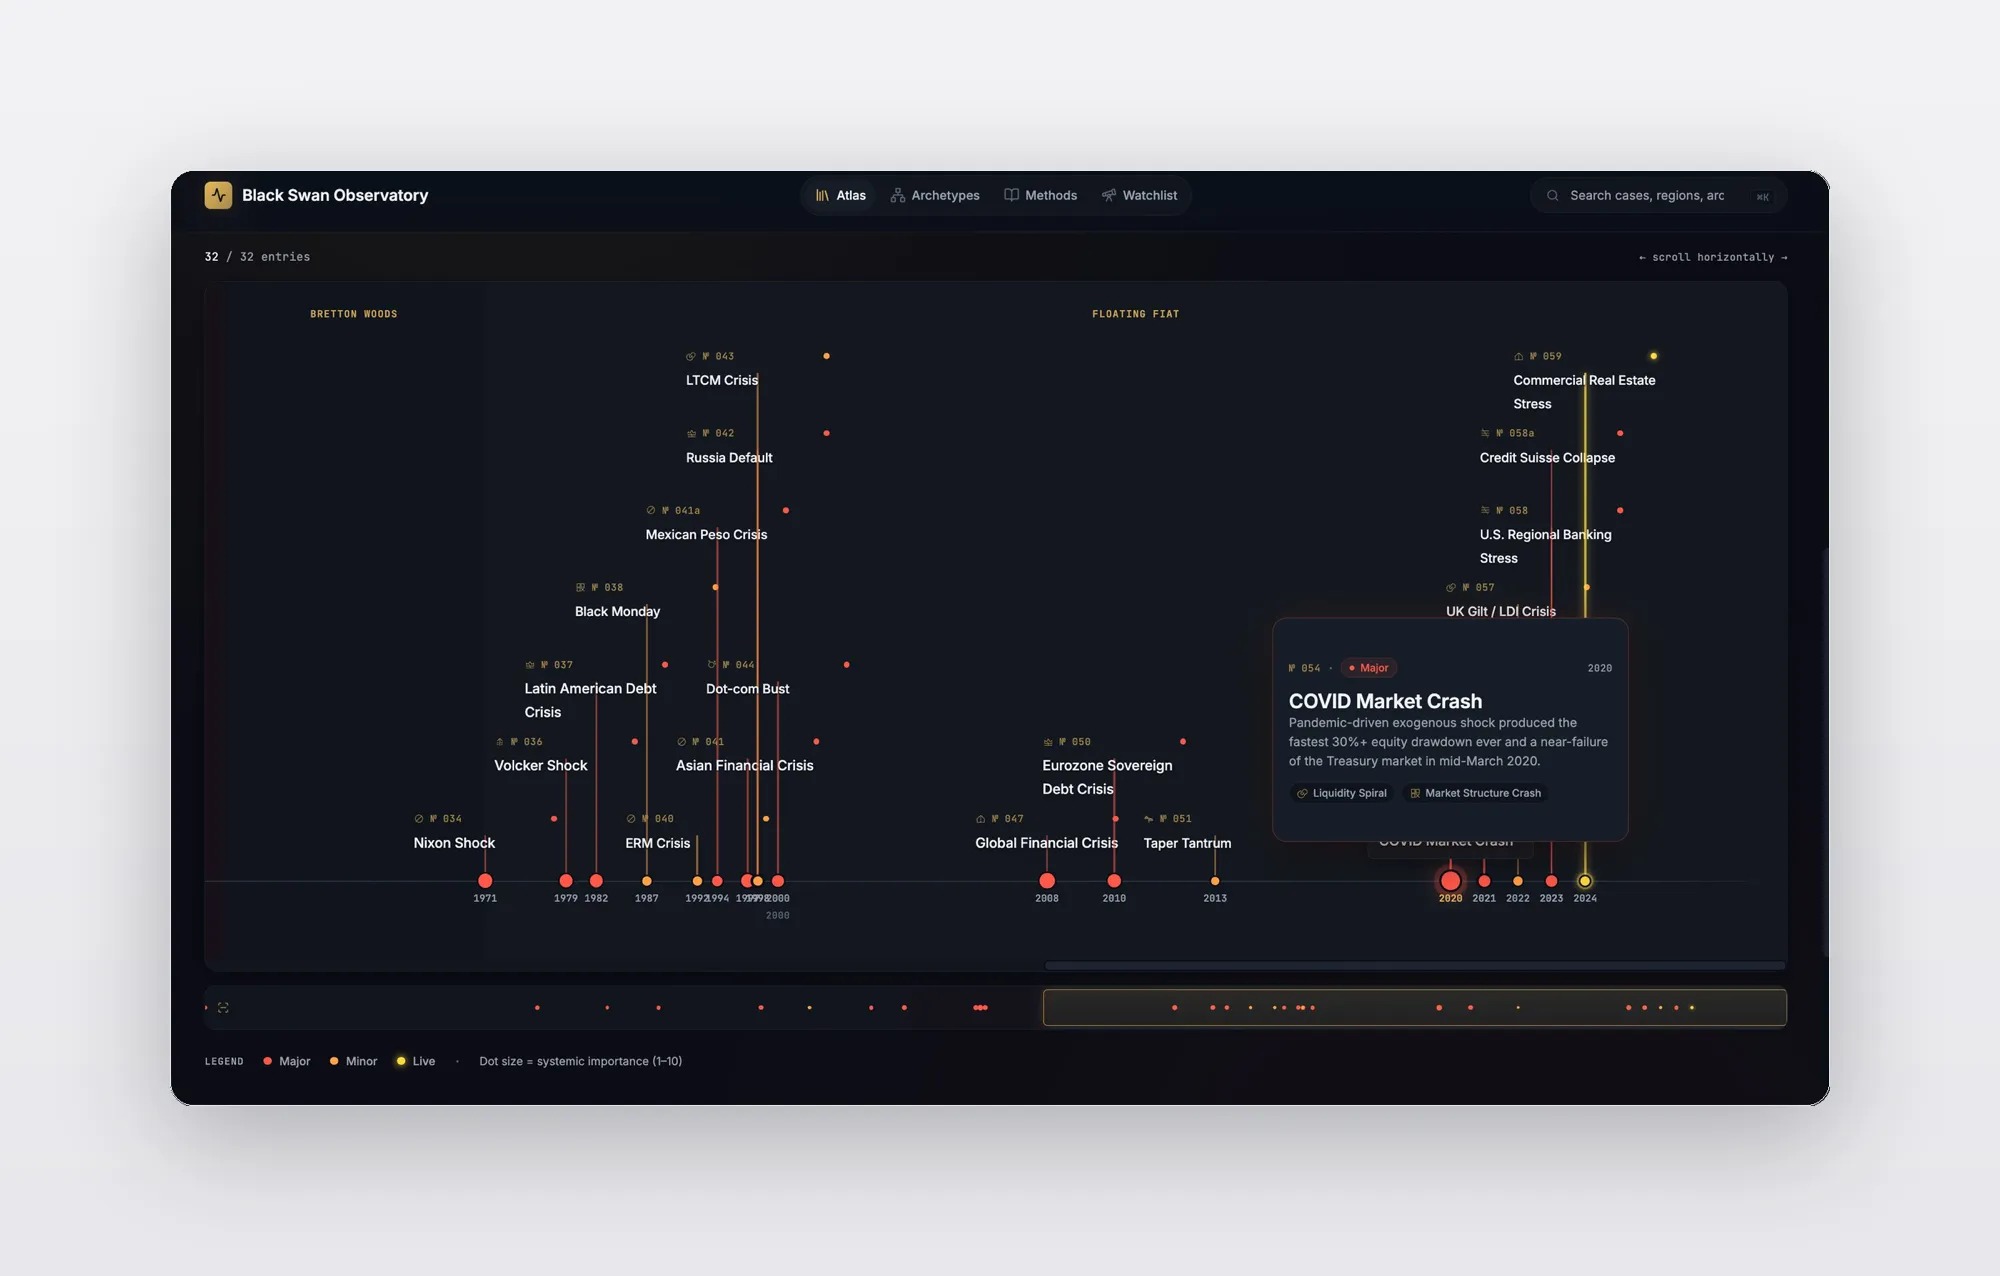
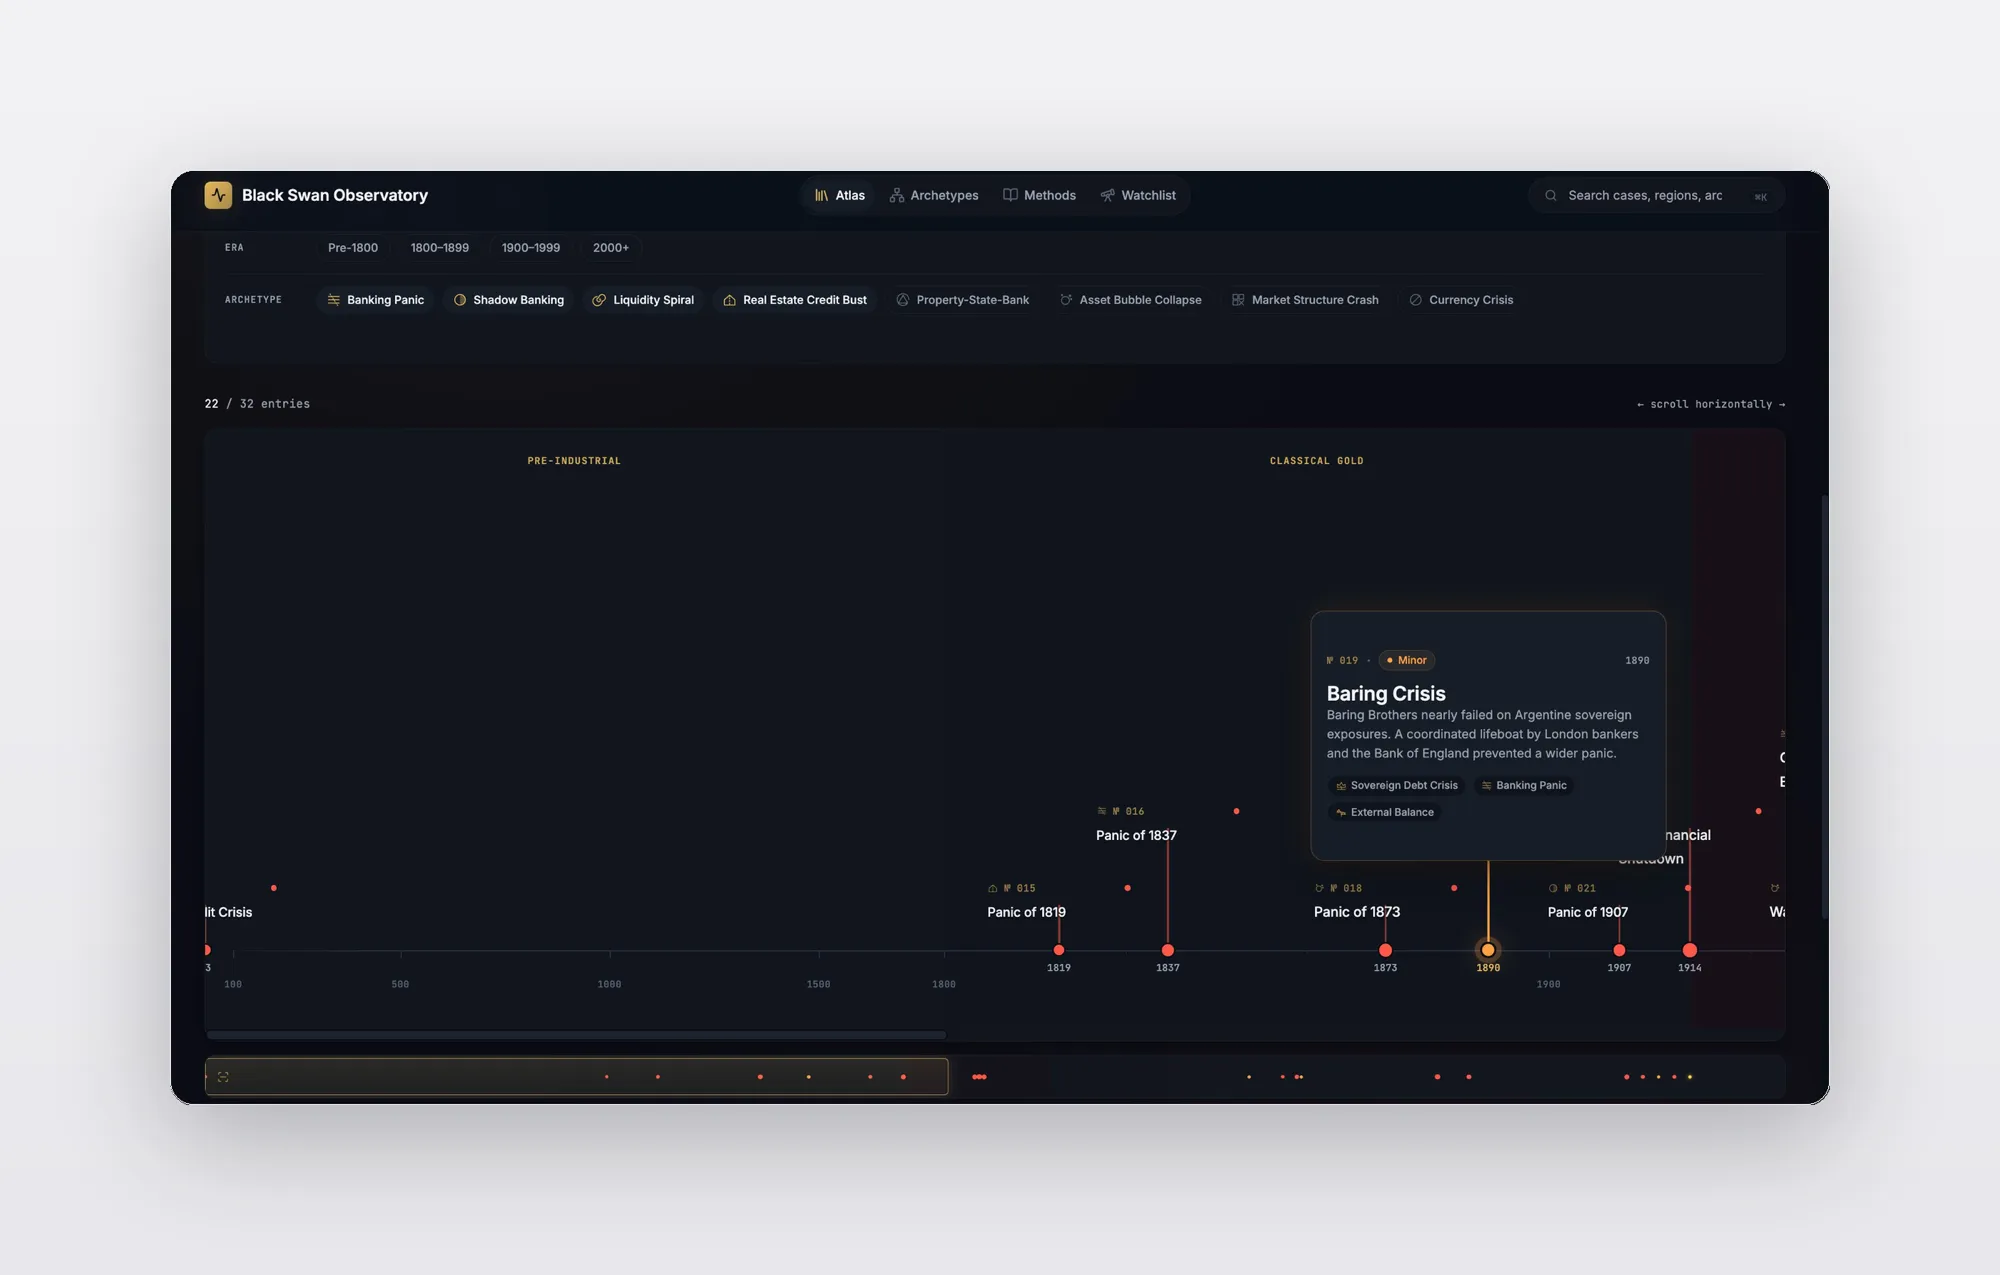
Black Swan Observatory. Interactive atlas mapping historical financial crises through an archetype taxonomy with similarity-based analogue retrieval.
About
Personal Project / Finance / Data Visualization
Tools
Figma, Claude Code, Cursor, React, Cloudflare
Role
Design Engineer, Self-initiated
Scope
•
Vibe-coded the full atlas frontend across 5 iterations — timeline canvas, constellation similarity map, and a 16-glyph archetype icon set
•
Three navigation lenses (Timeline, Constellation, Case) so users can shift mental models without losing context
•
Token-based design system bridging custom visualizations and UI primitives
Jul 2023 – May 2025
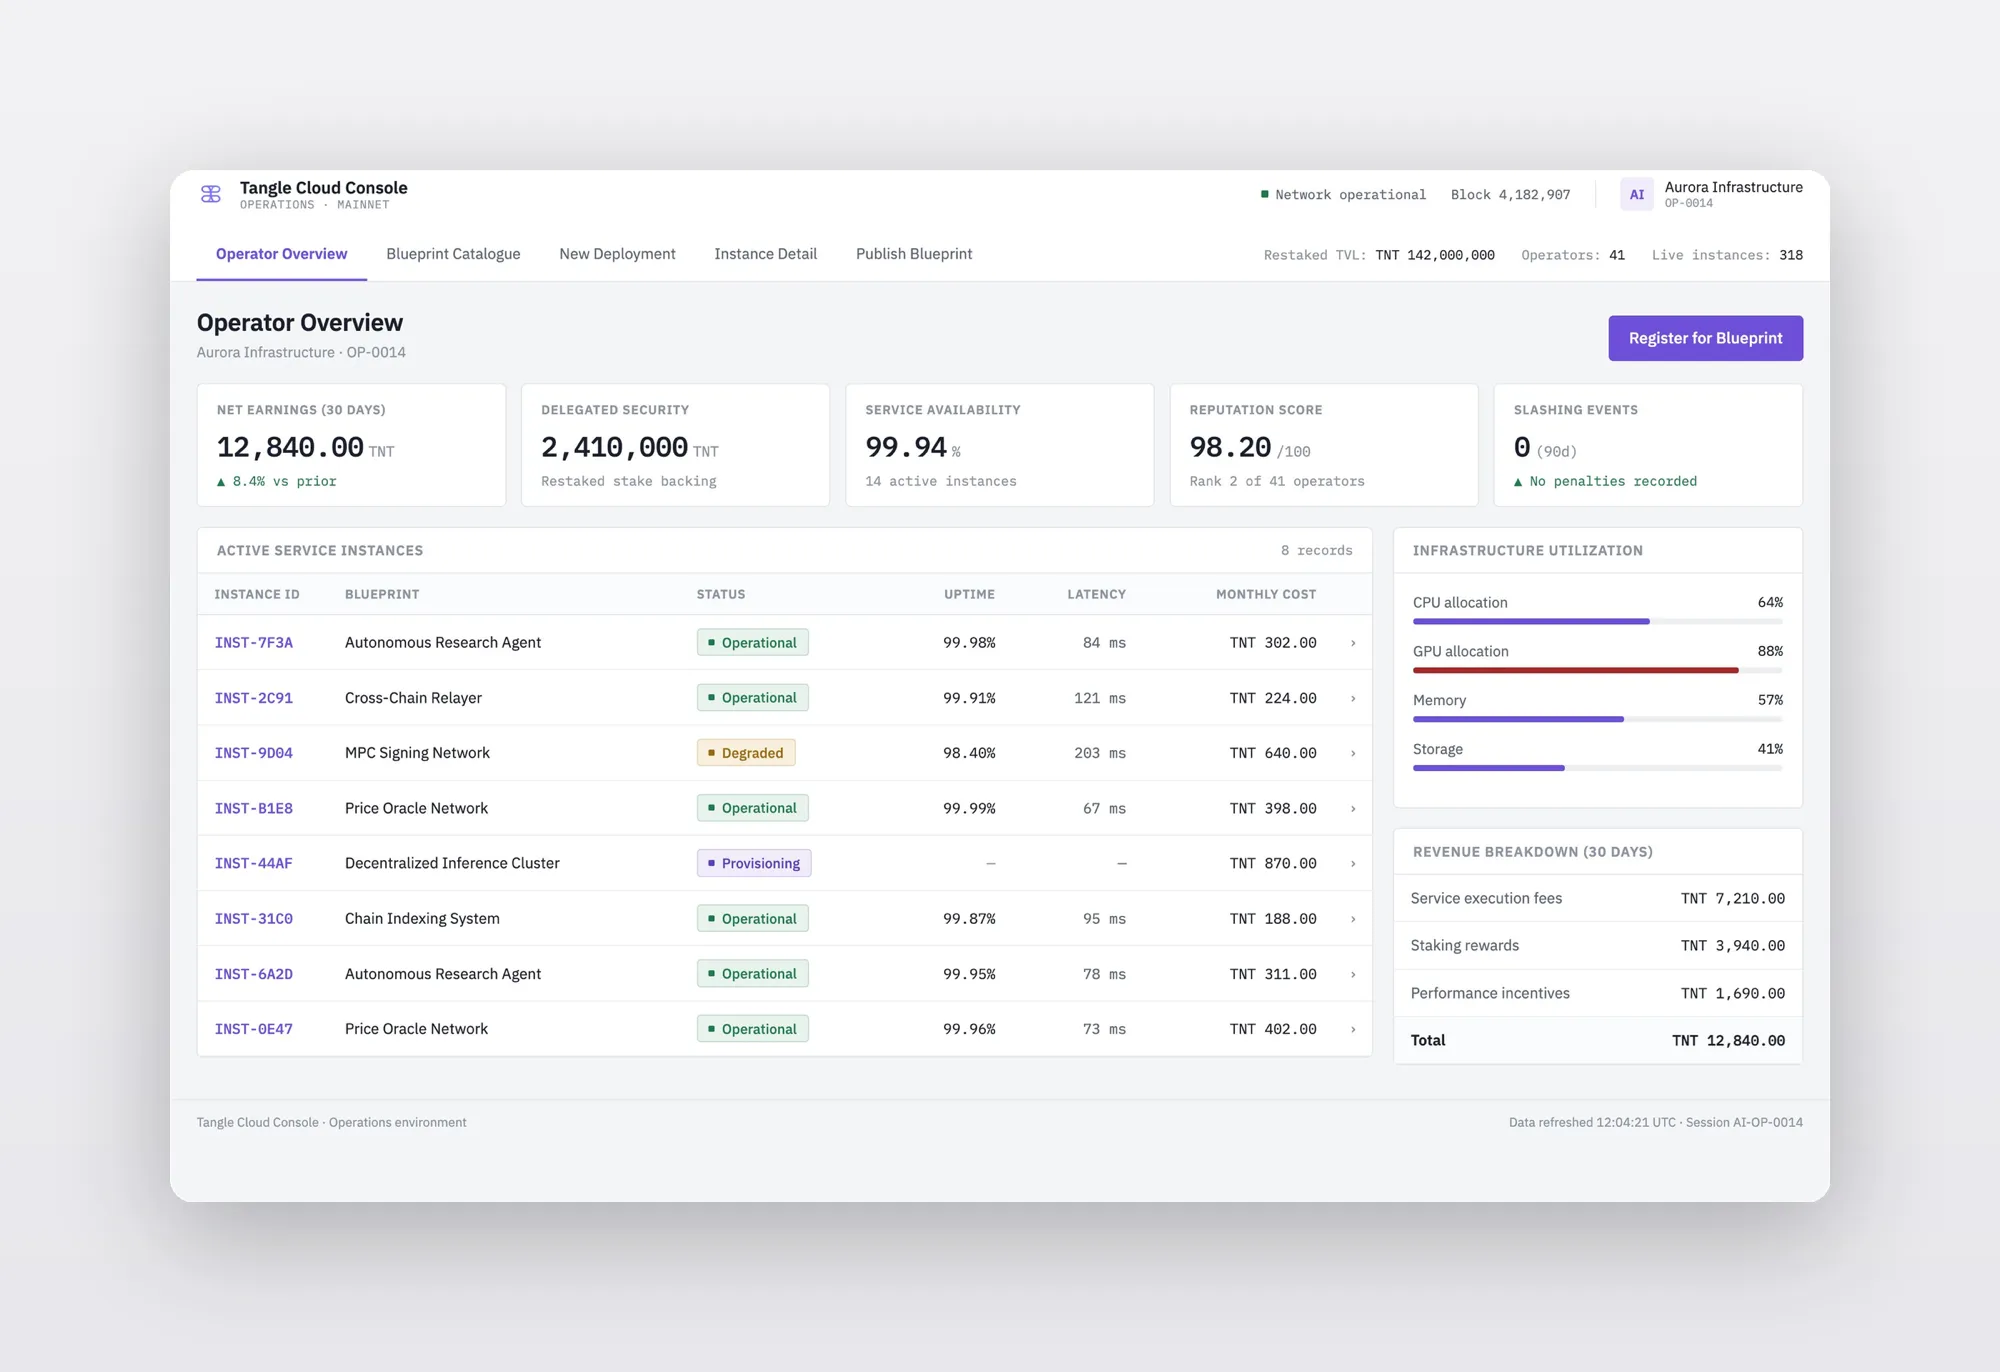
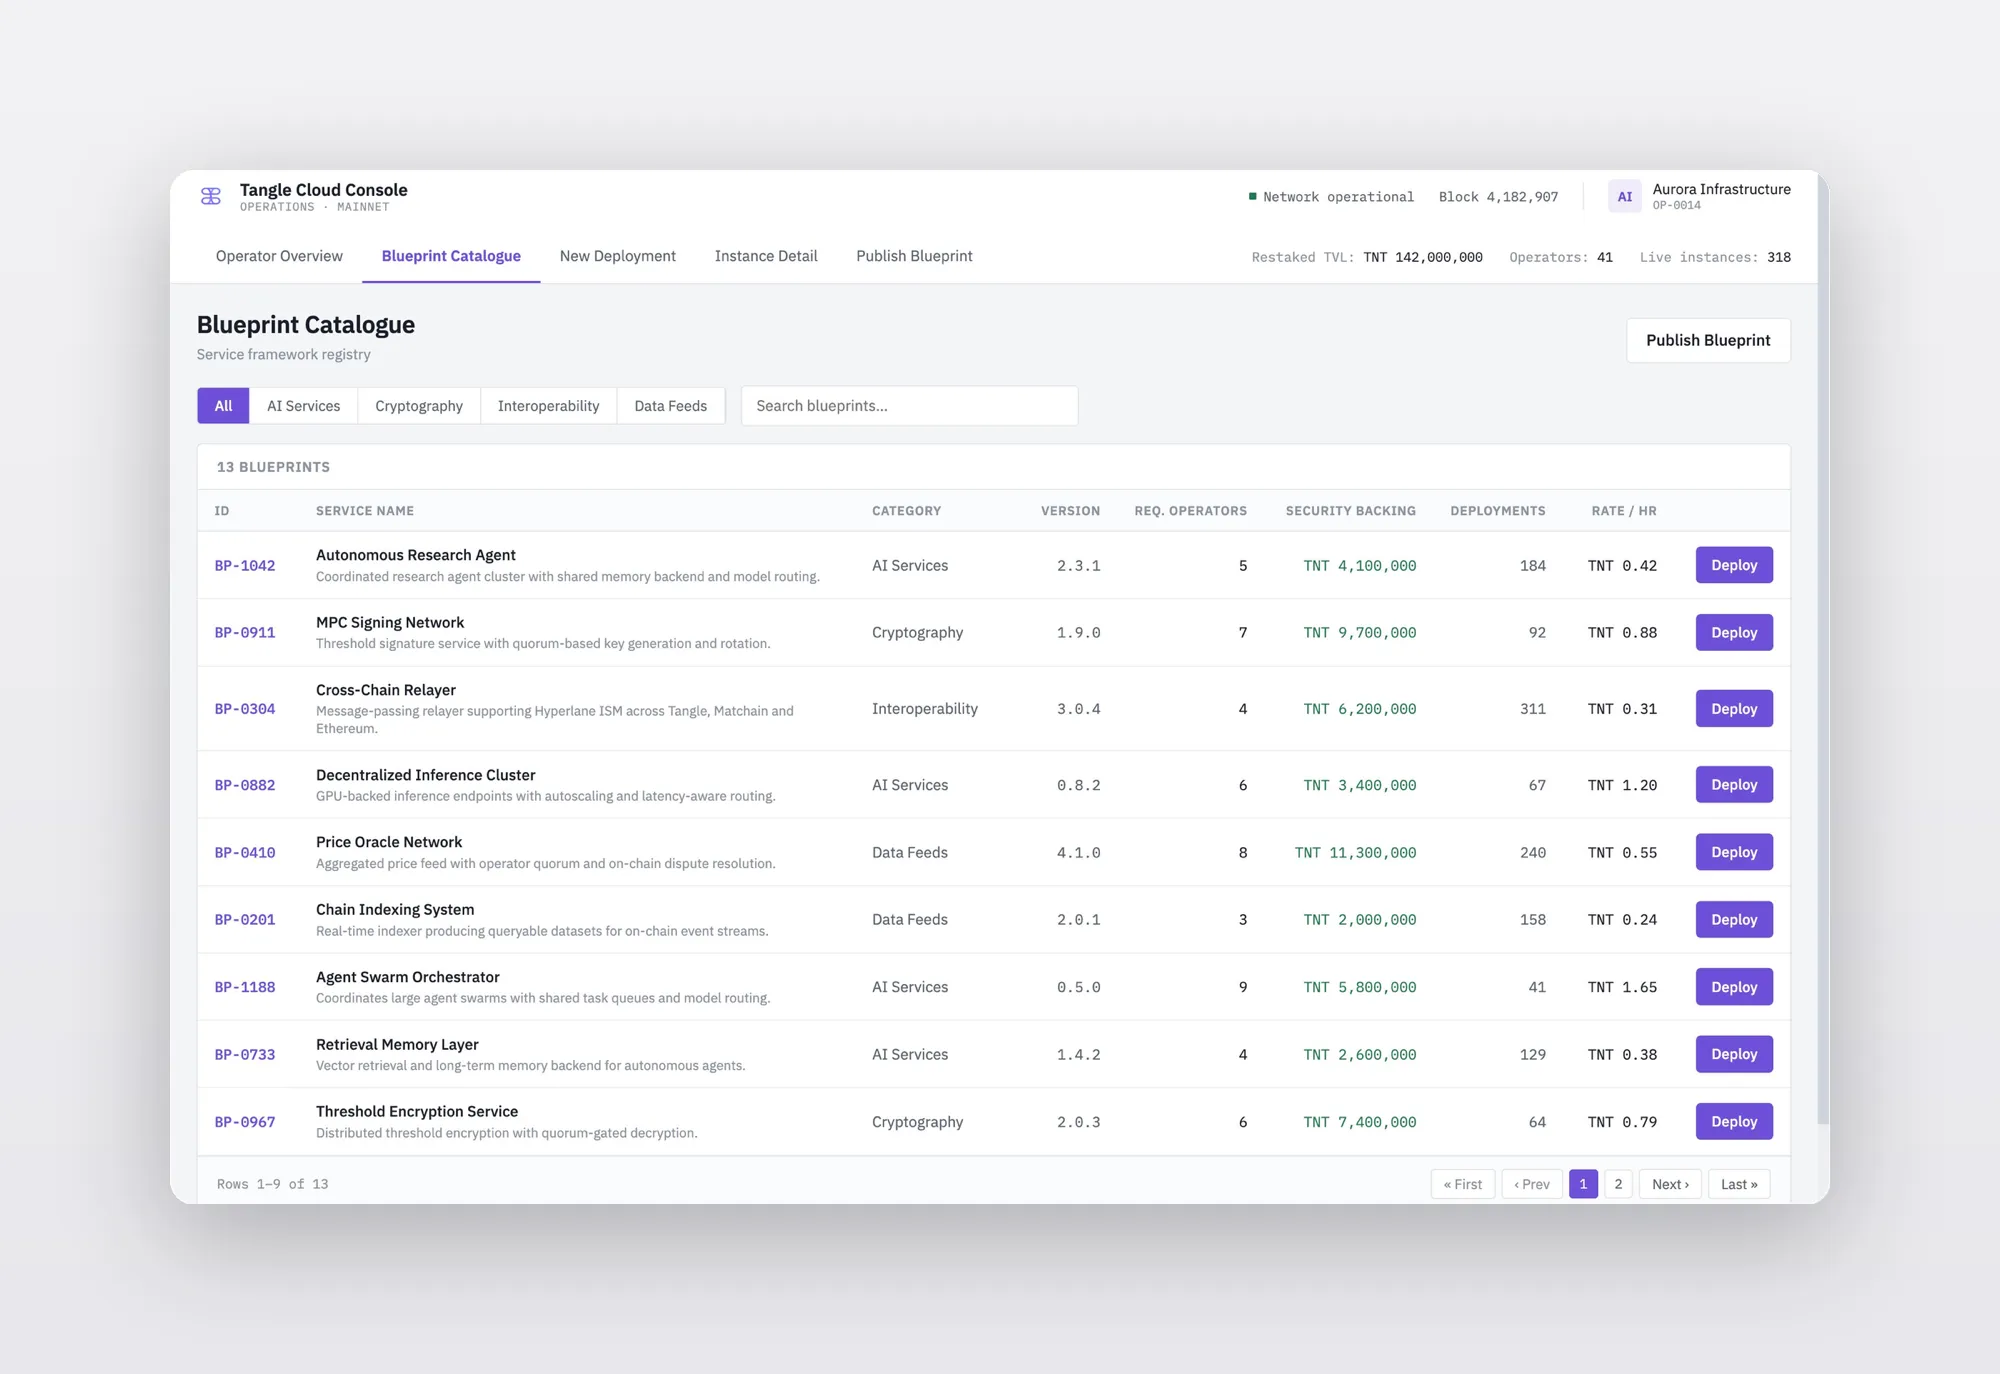
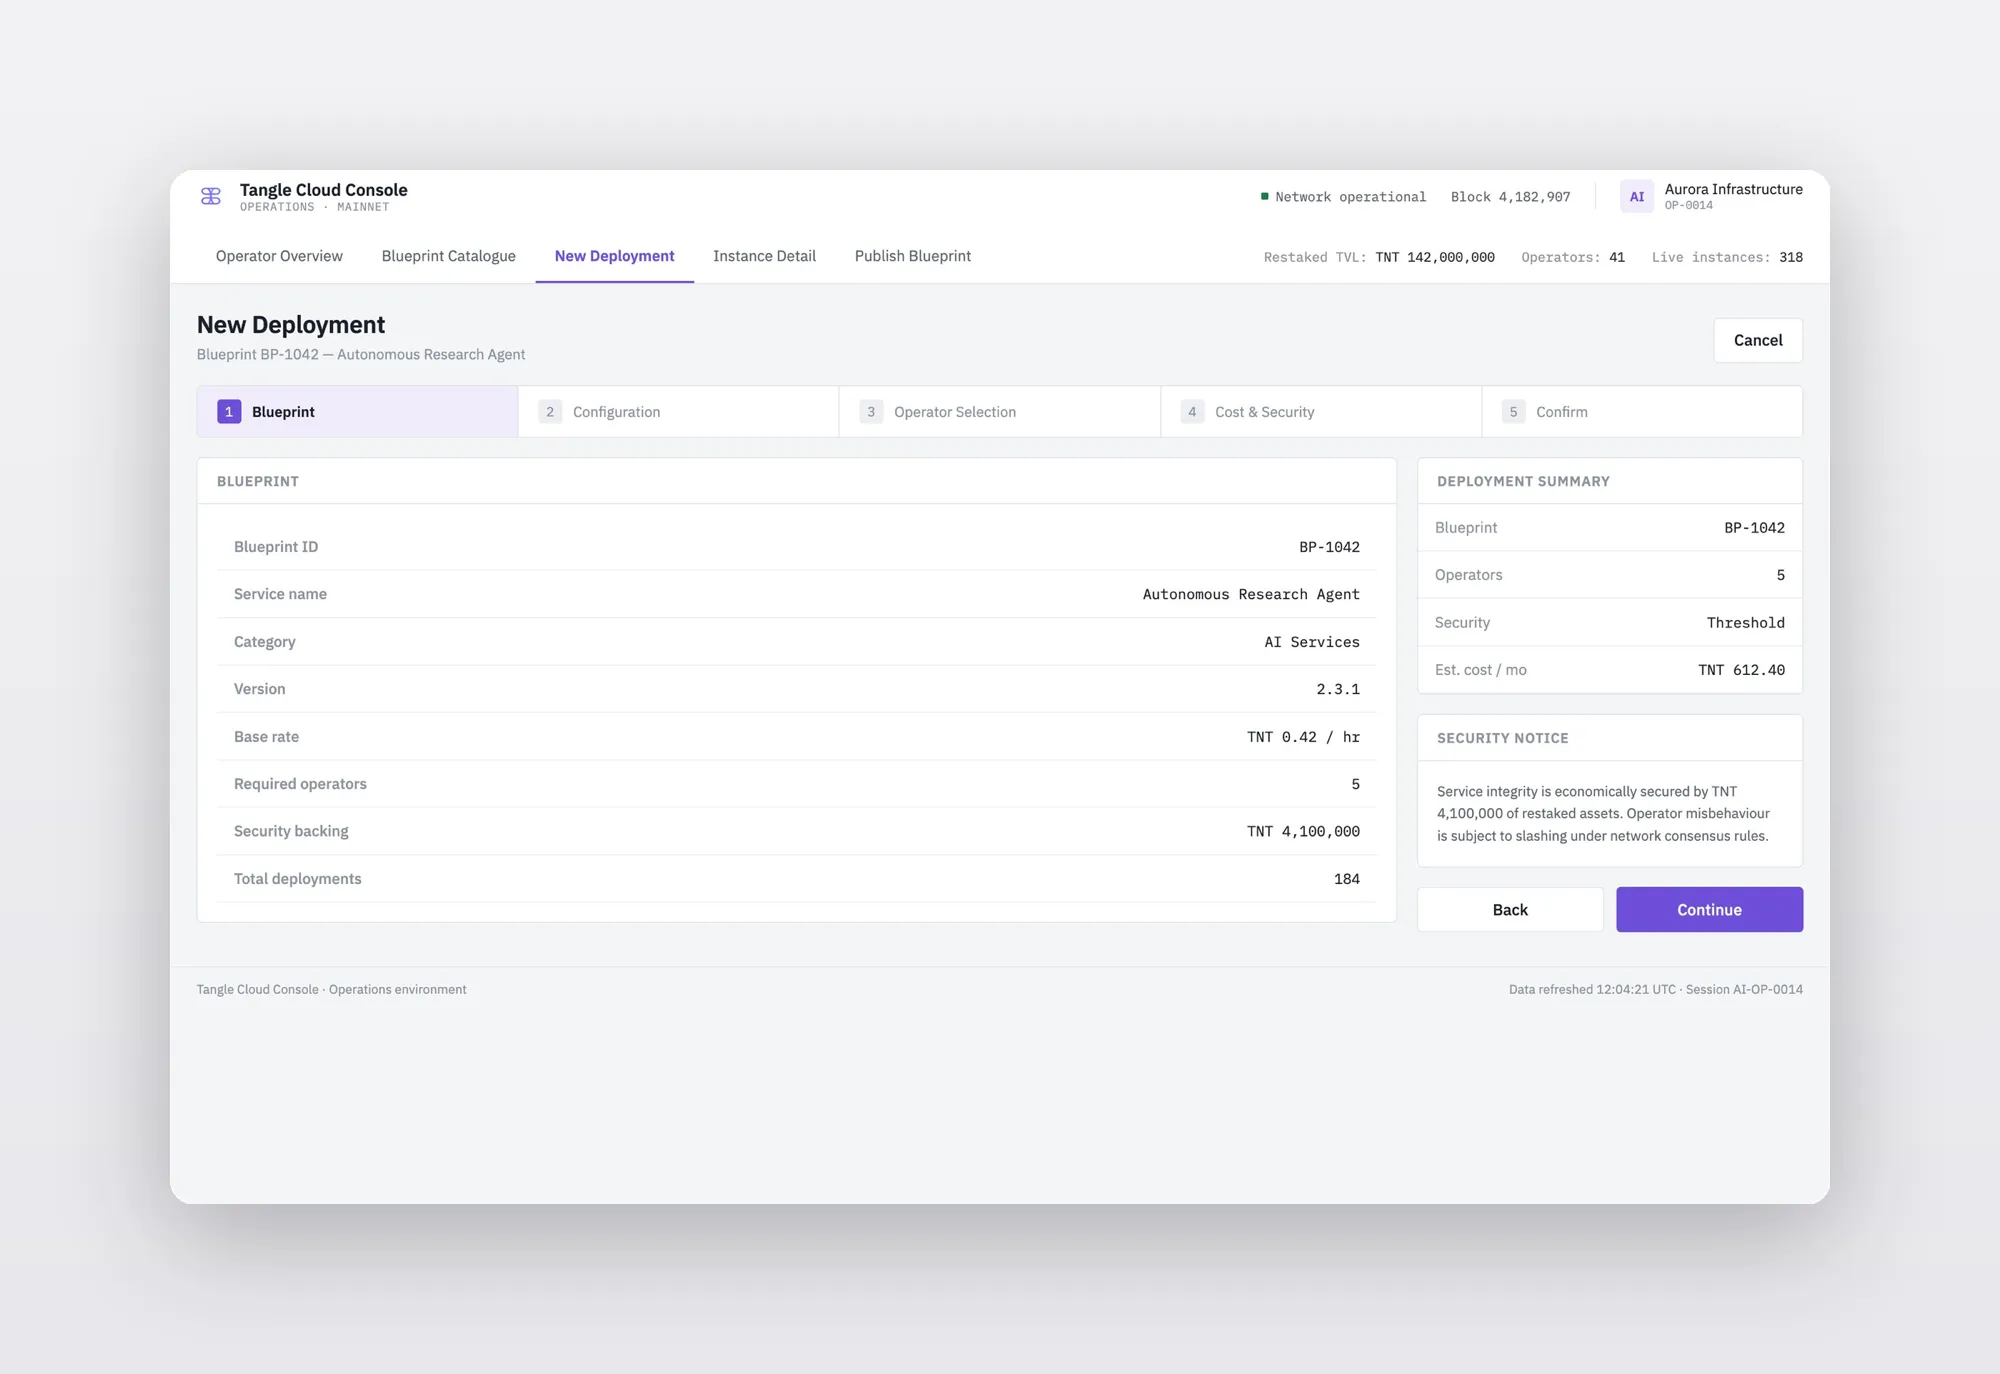
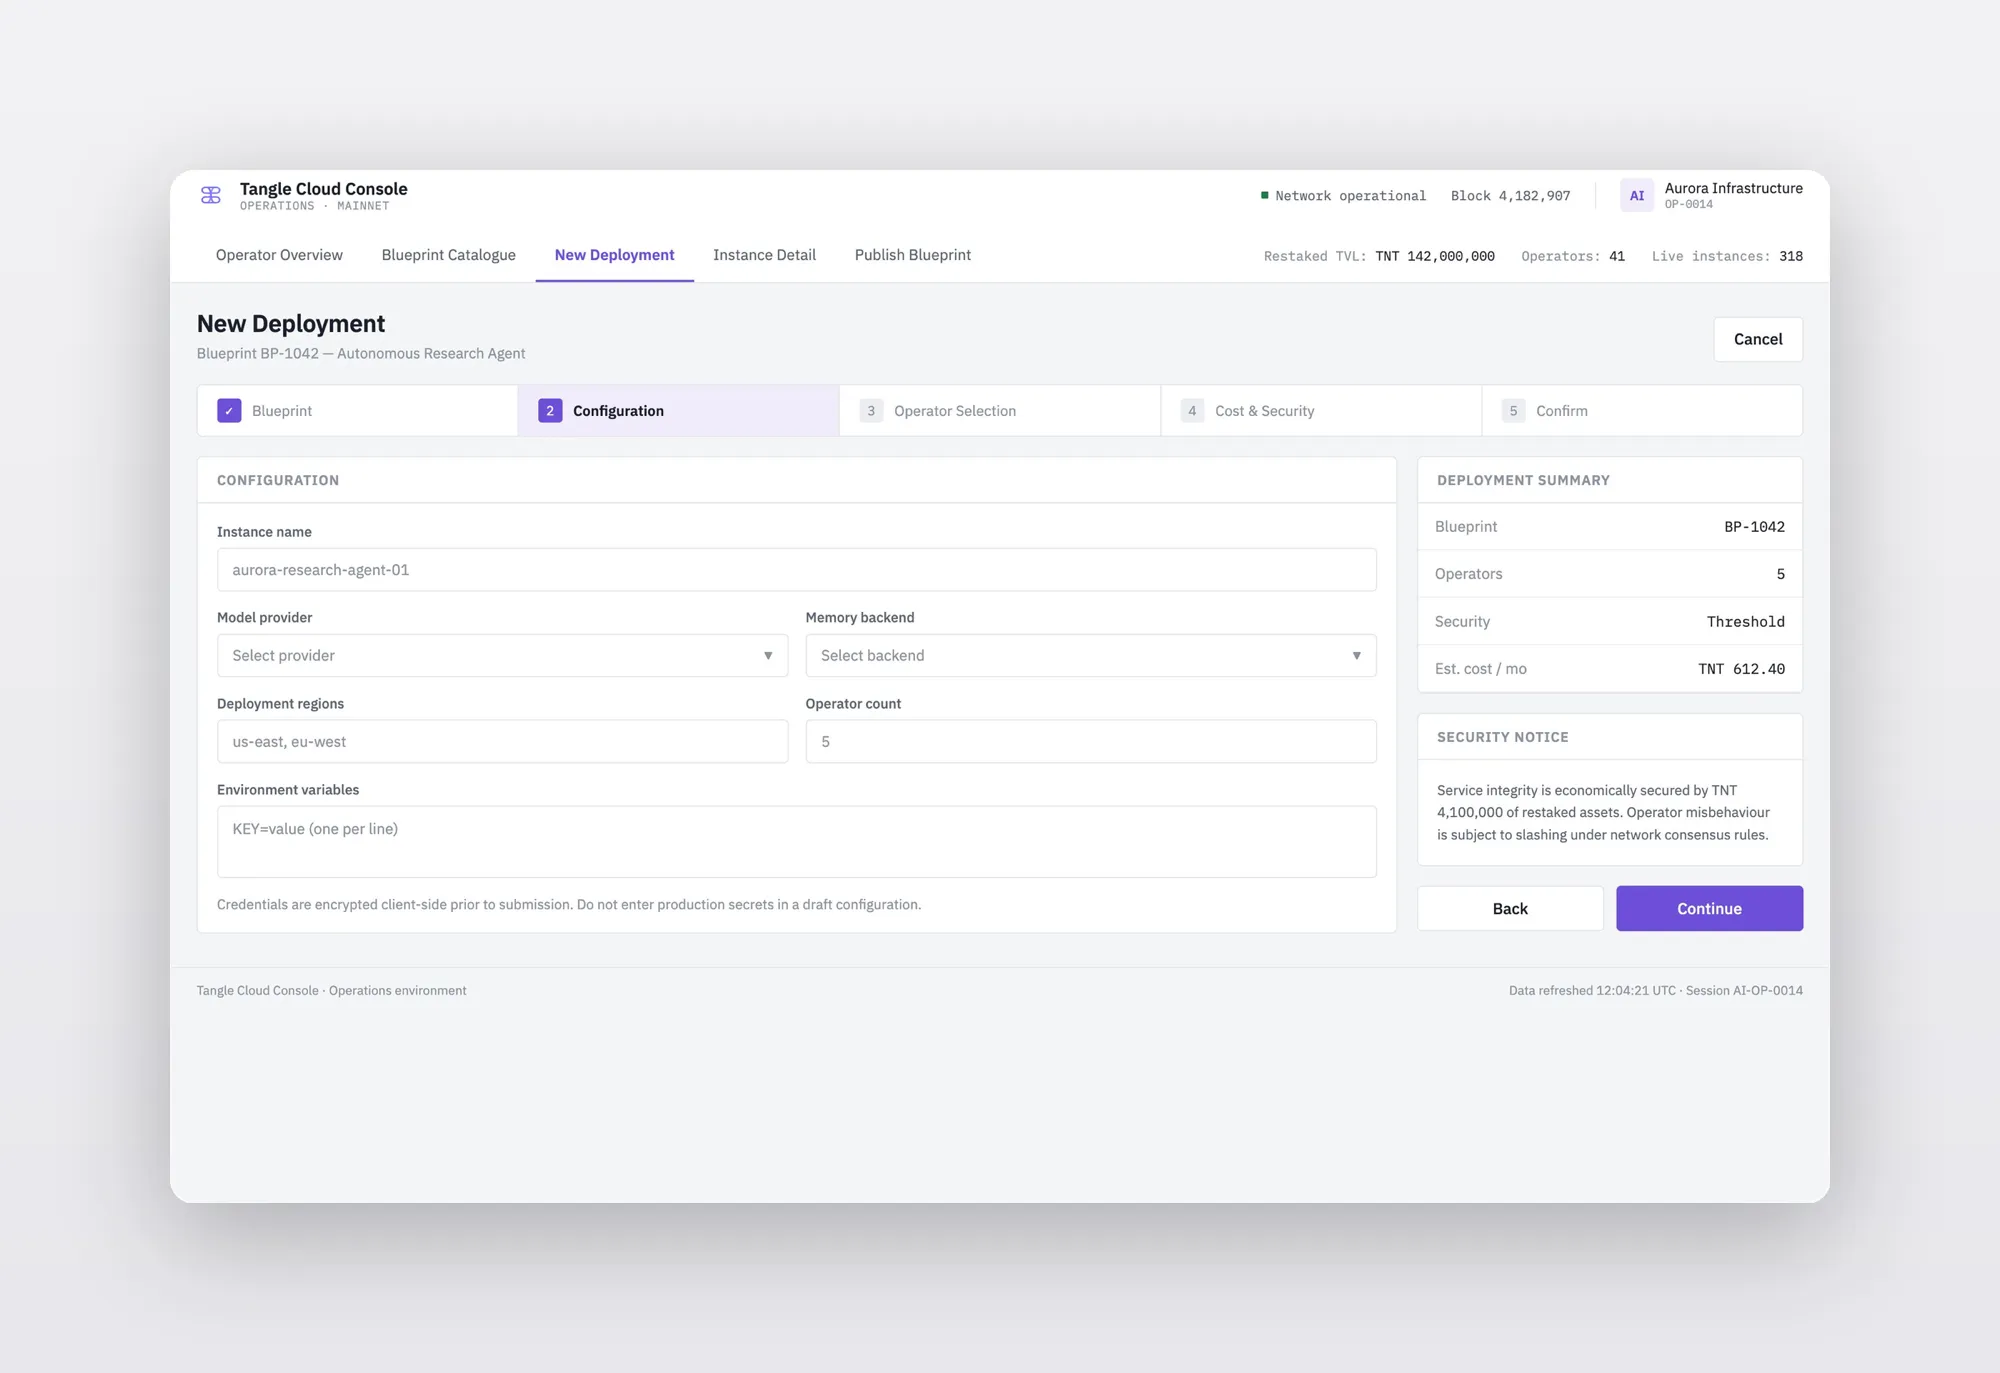
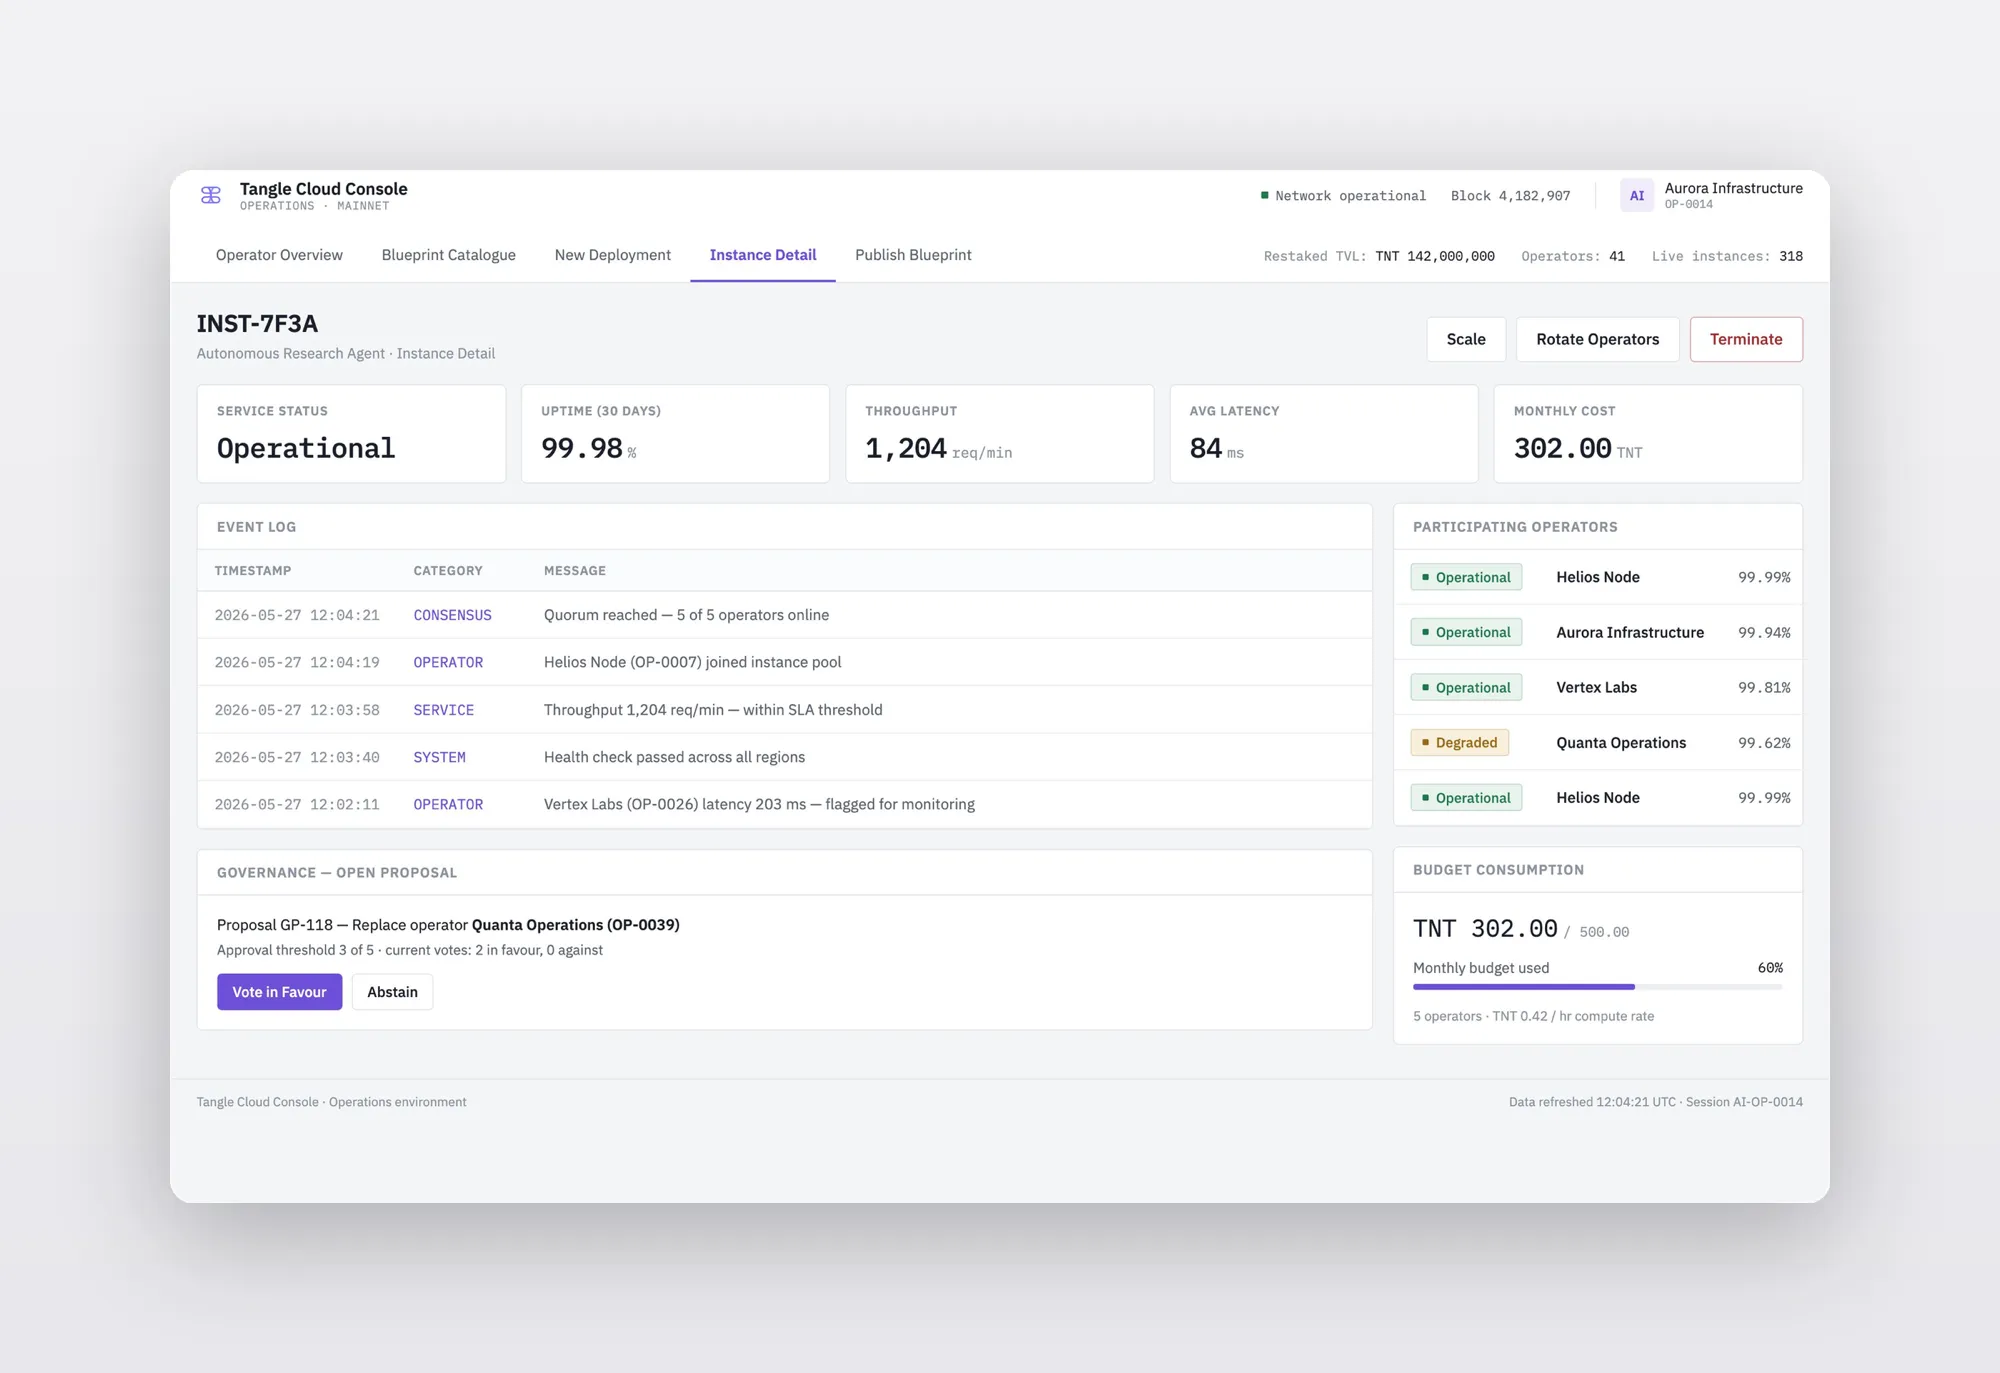
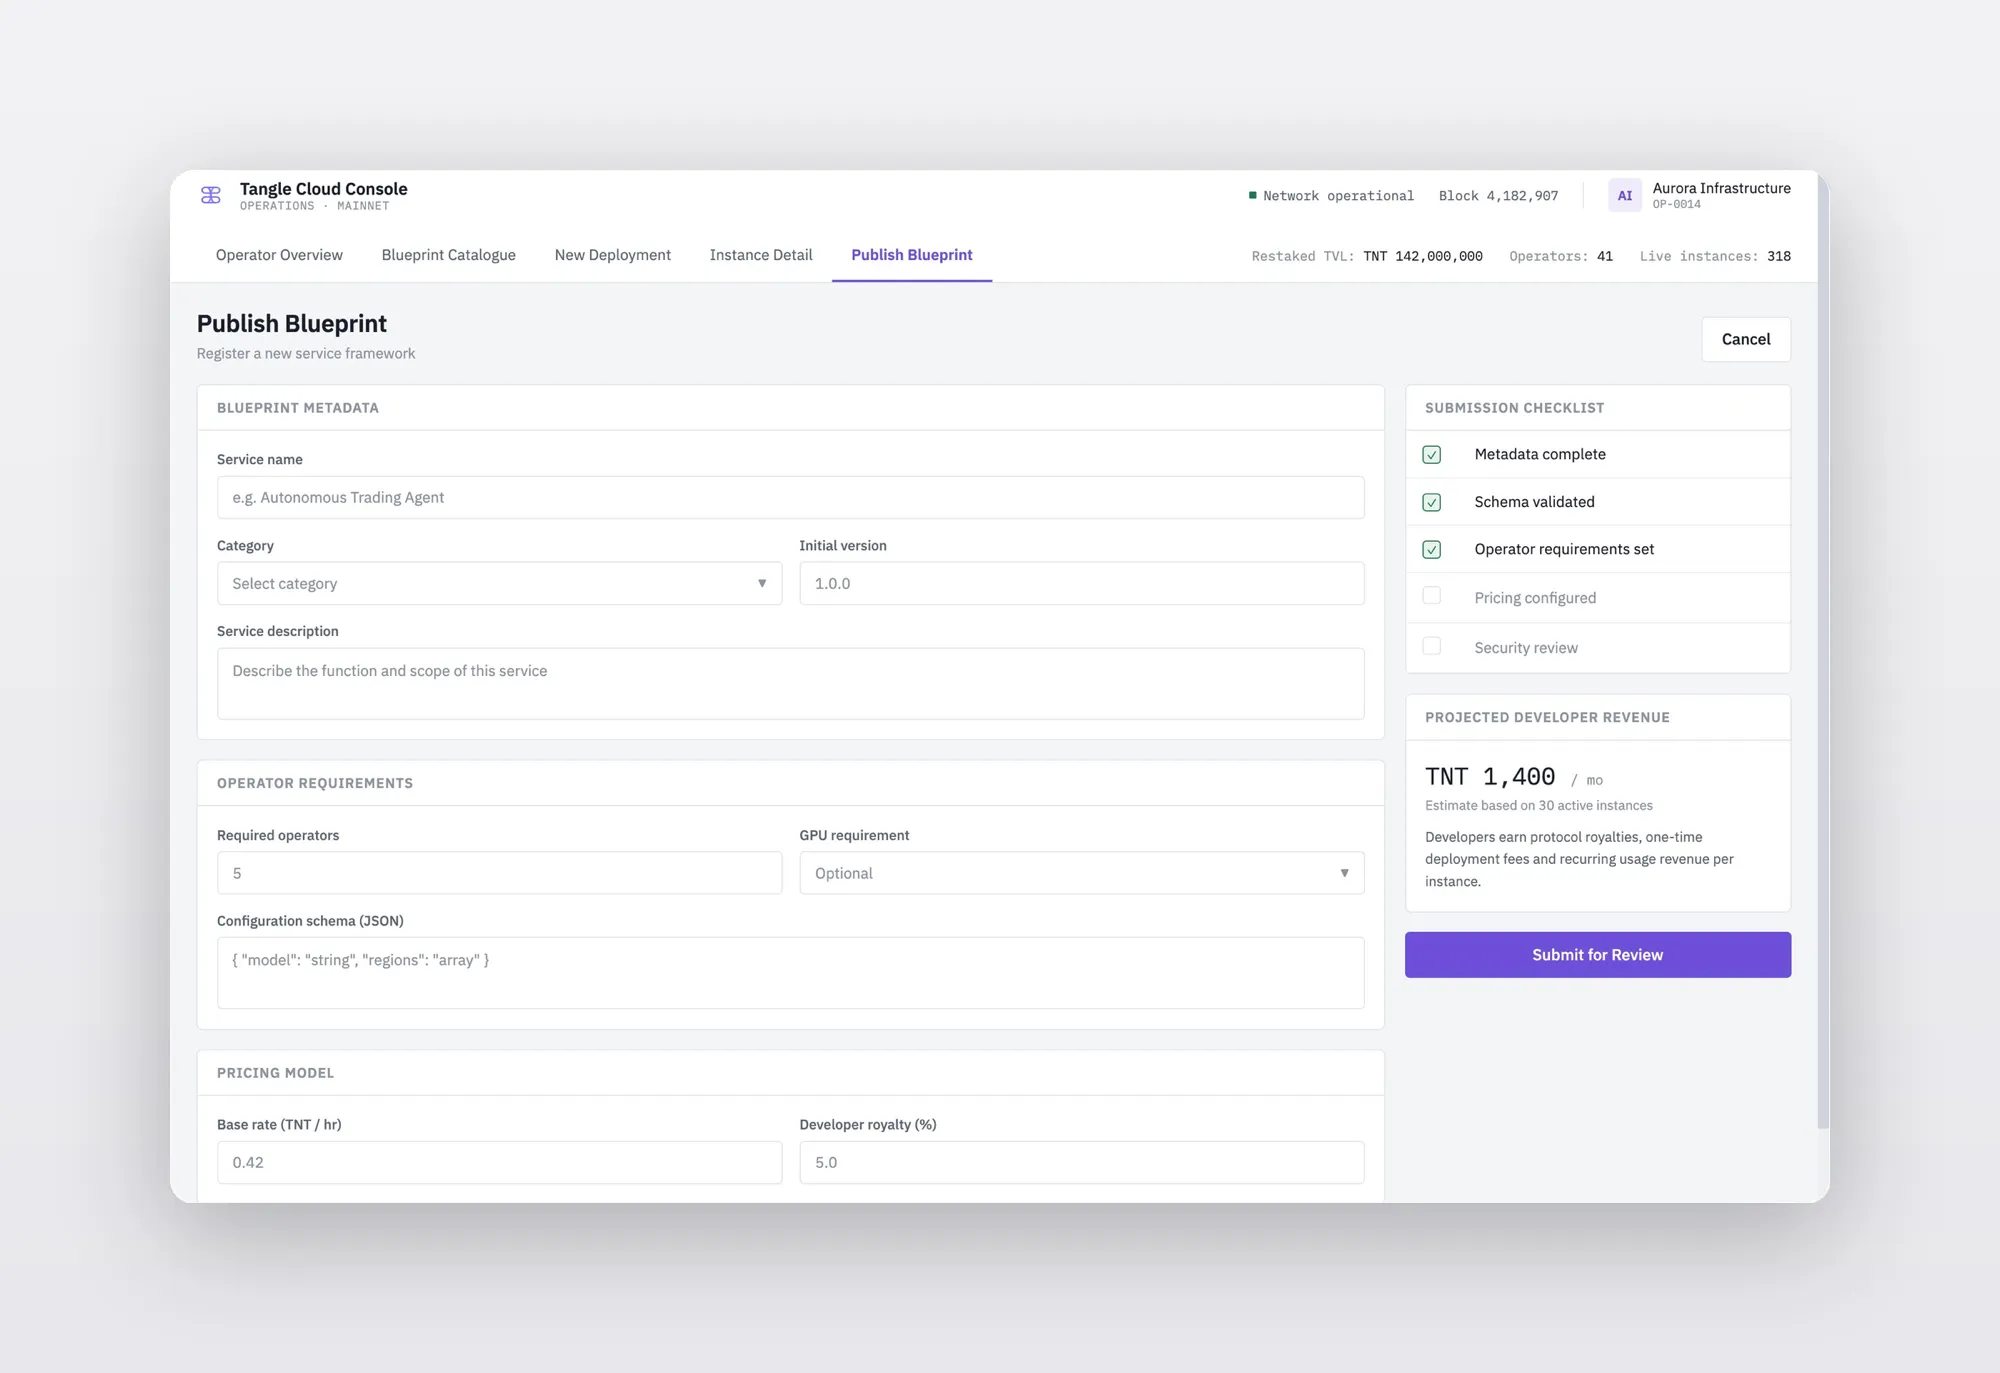
Tangle Cloud Console. Operator tooling for an AI service infrastructure — Blueprint deployment, agent orchestration, and coordination for operators and developers on restaked security.
About
AI / Blockchain Infrastructure
Users
Operators, Blueprint developers, deployers
Tools
Figma
Role
Design Lead
Scope
•
Designed the operator experience — Blueprint deployment, agent orchestration, service management, and publish flows — shipping a deployment wizard operators could complete unaided
•
Explored RBAC models for different personas and multi-provider integration patterns
•
Drove the split into Cloud Console (operators) and dApp (token holders) for sharper audience focus
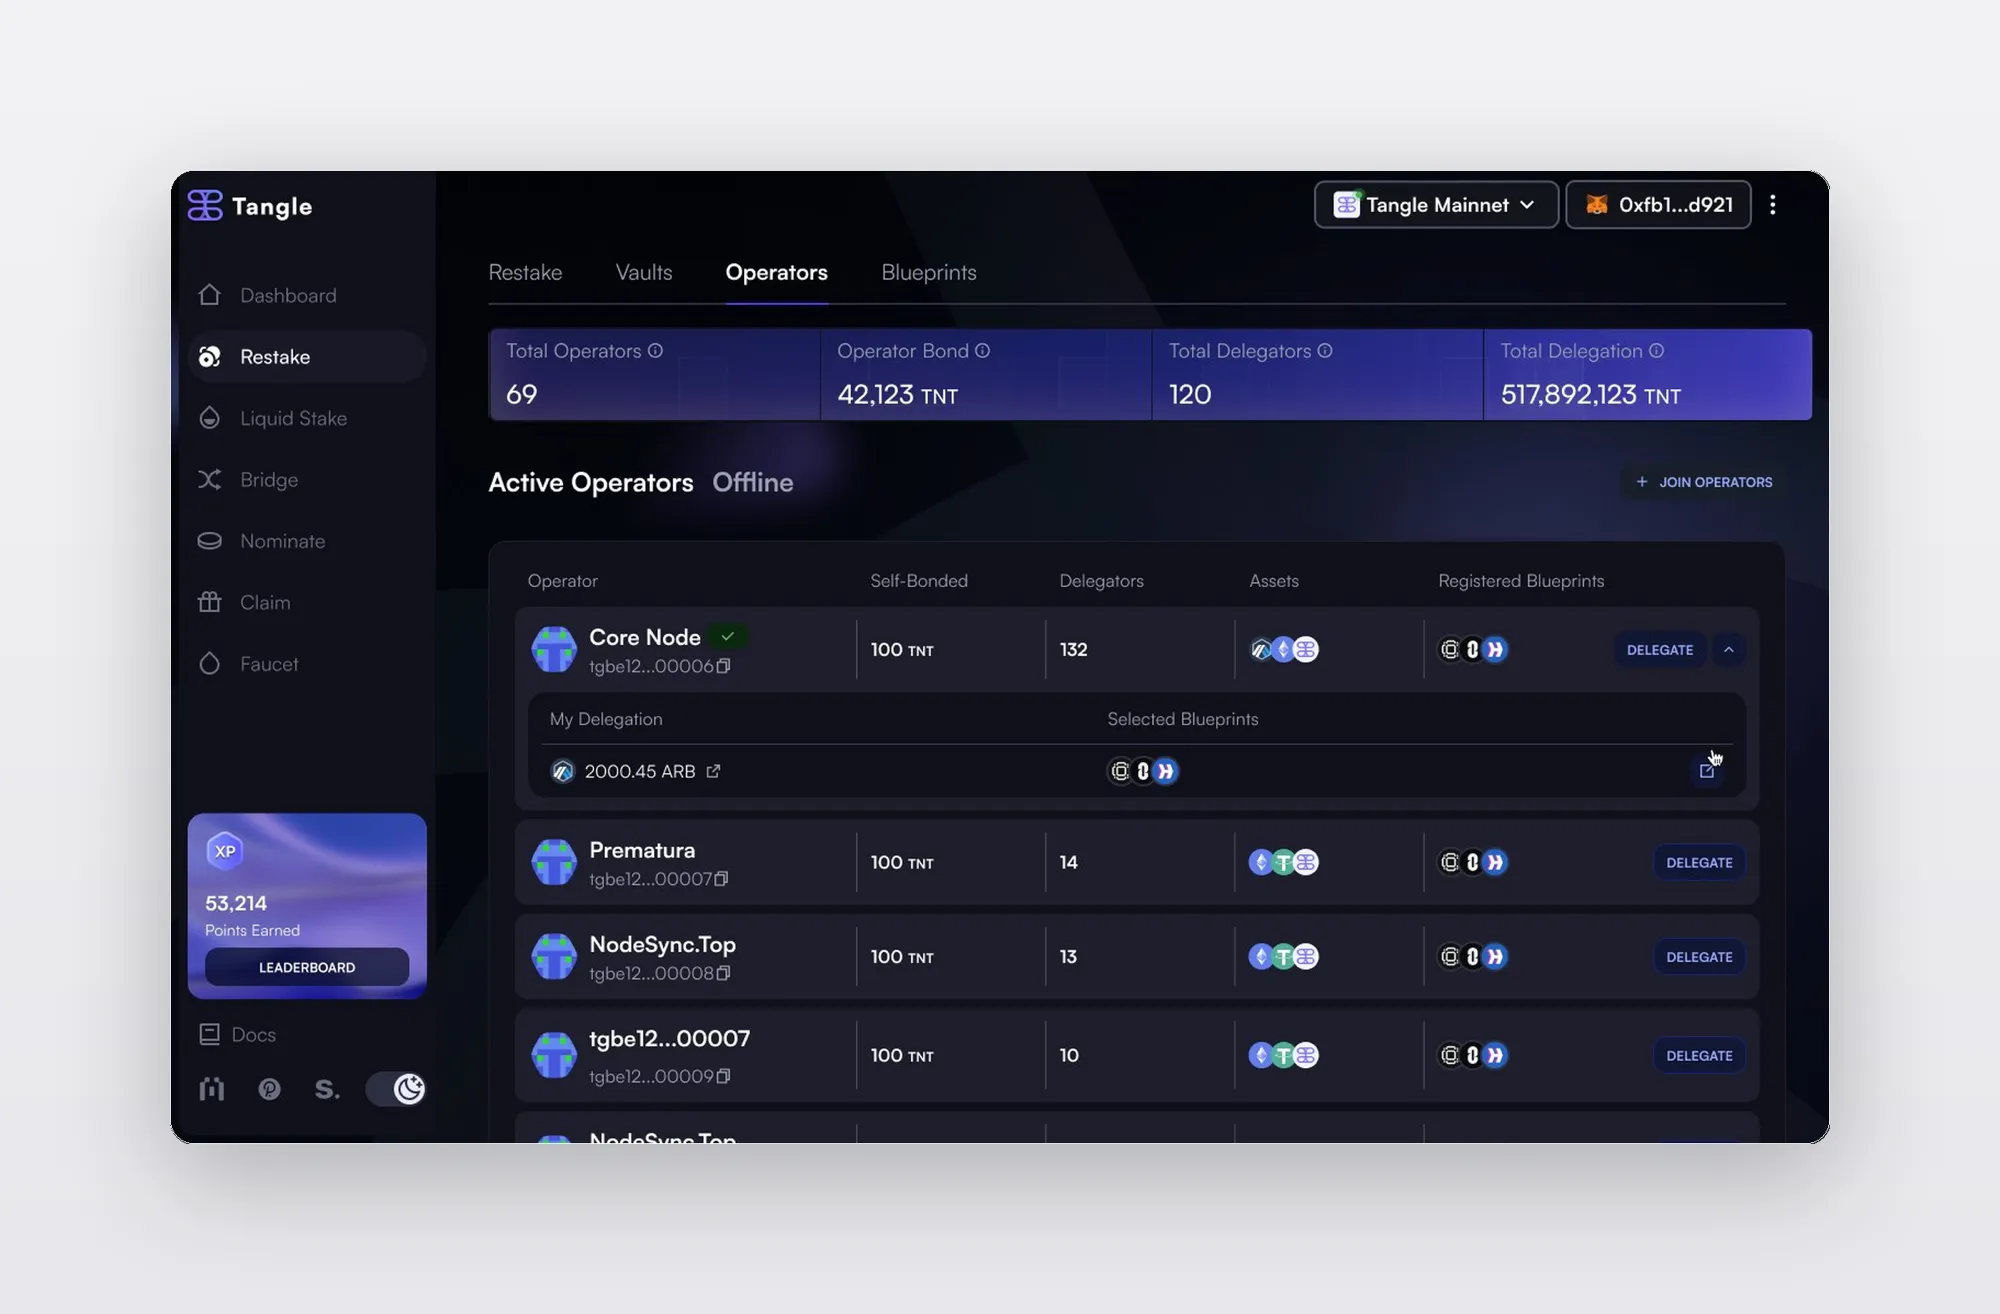
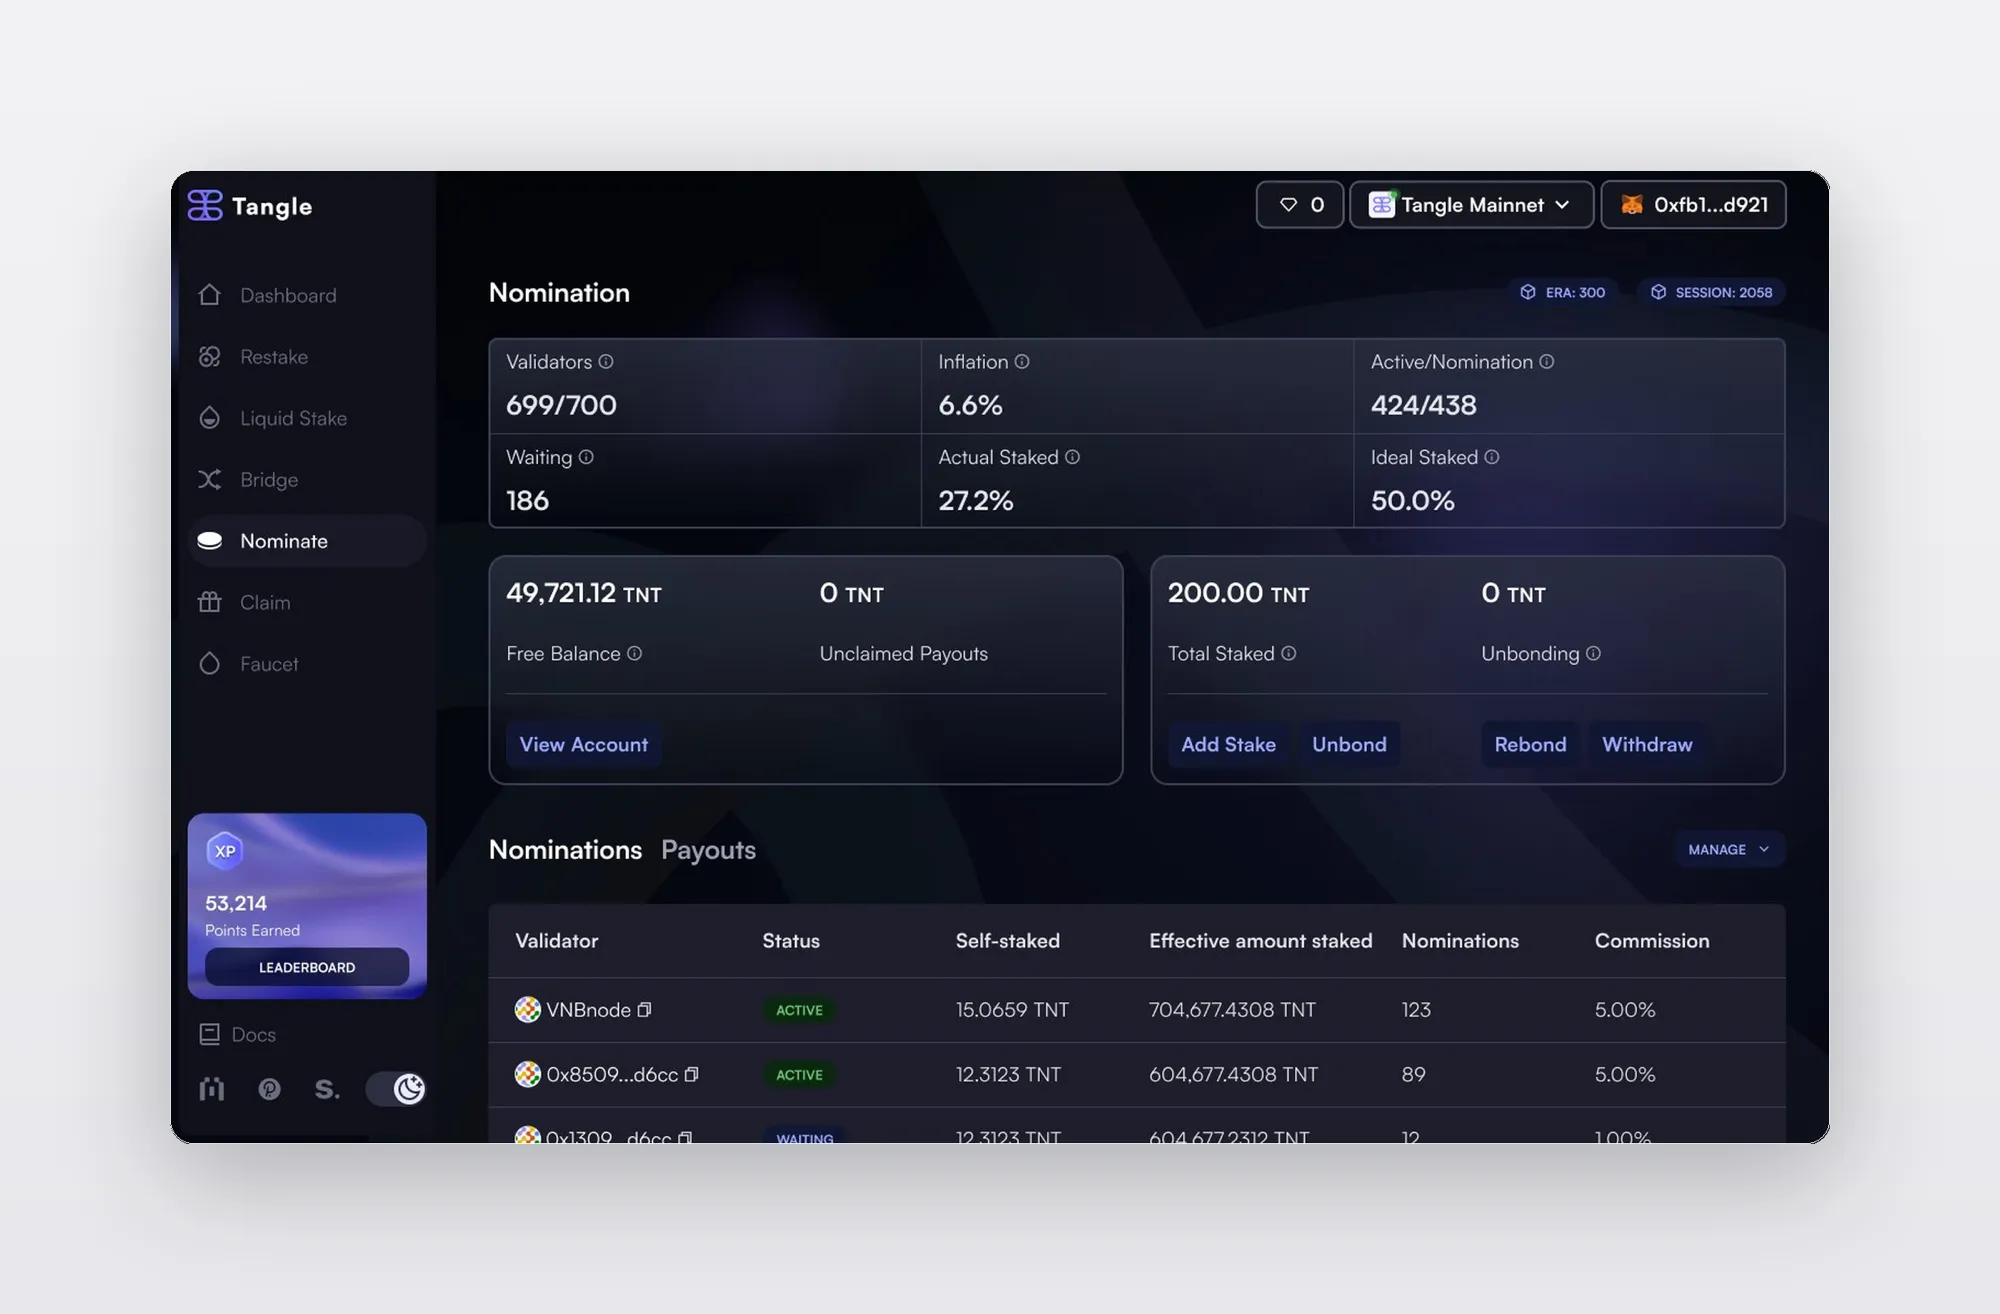
Jul 2023 – May 2025
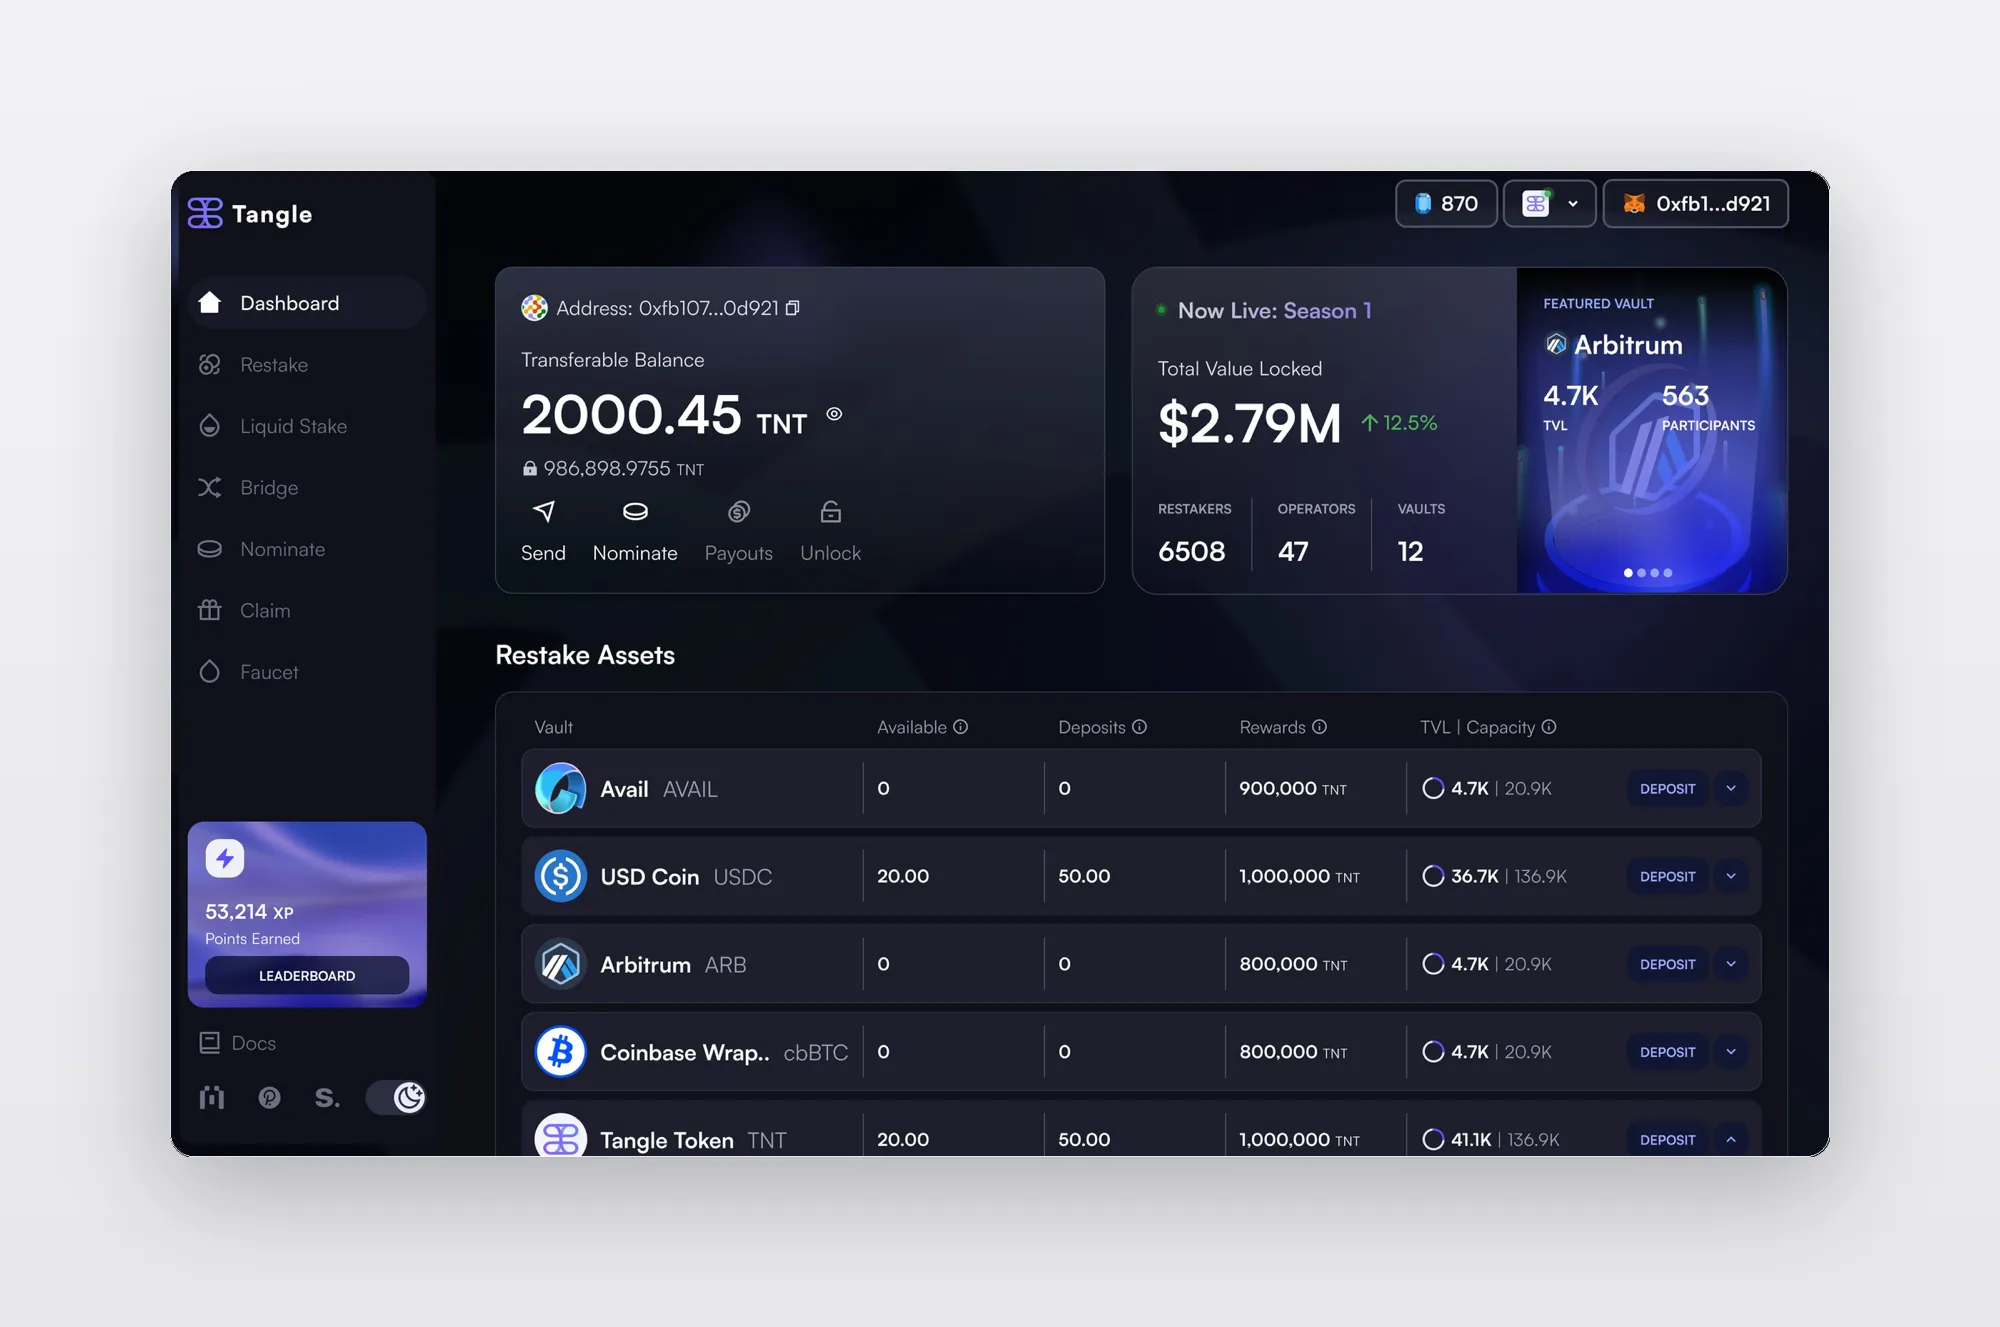
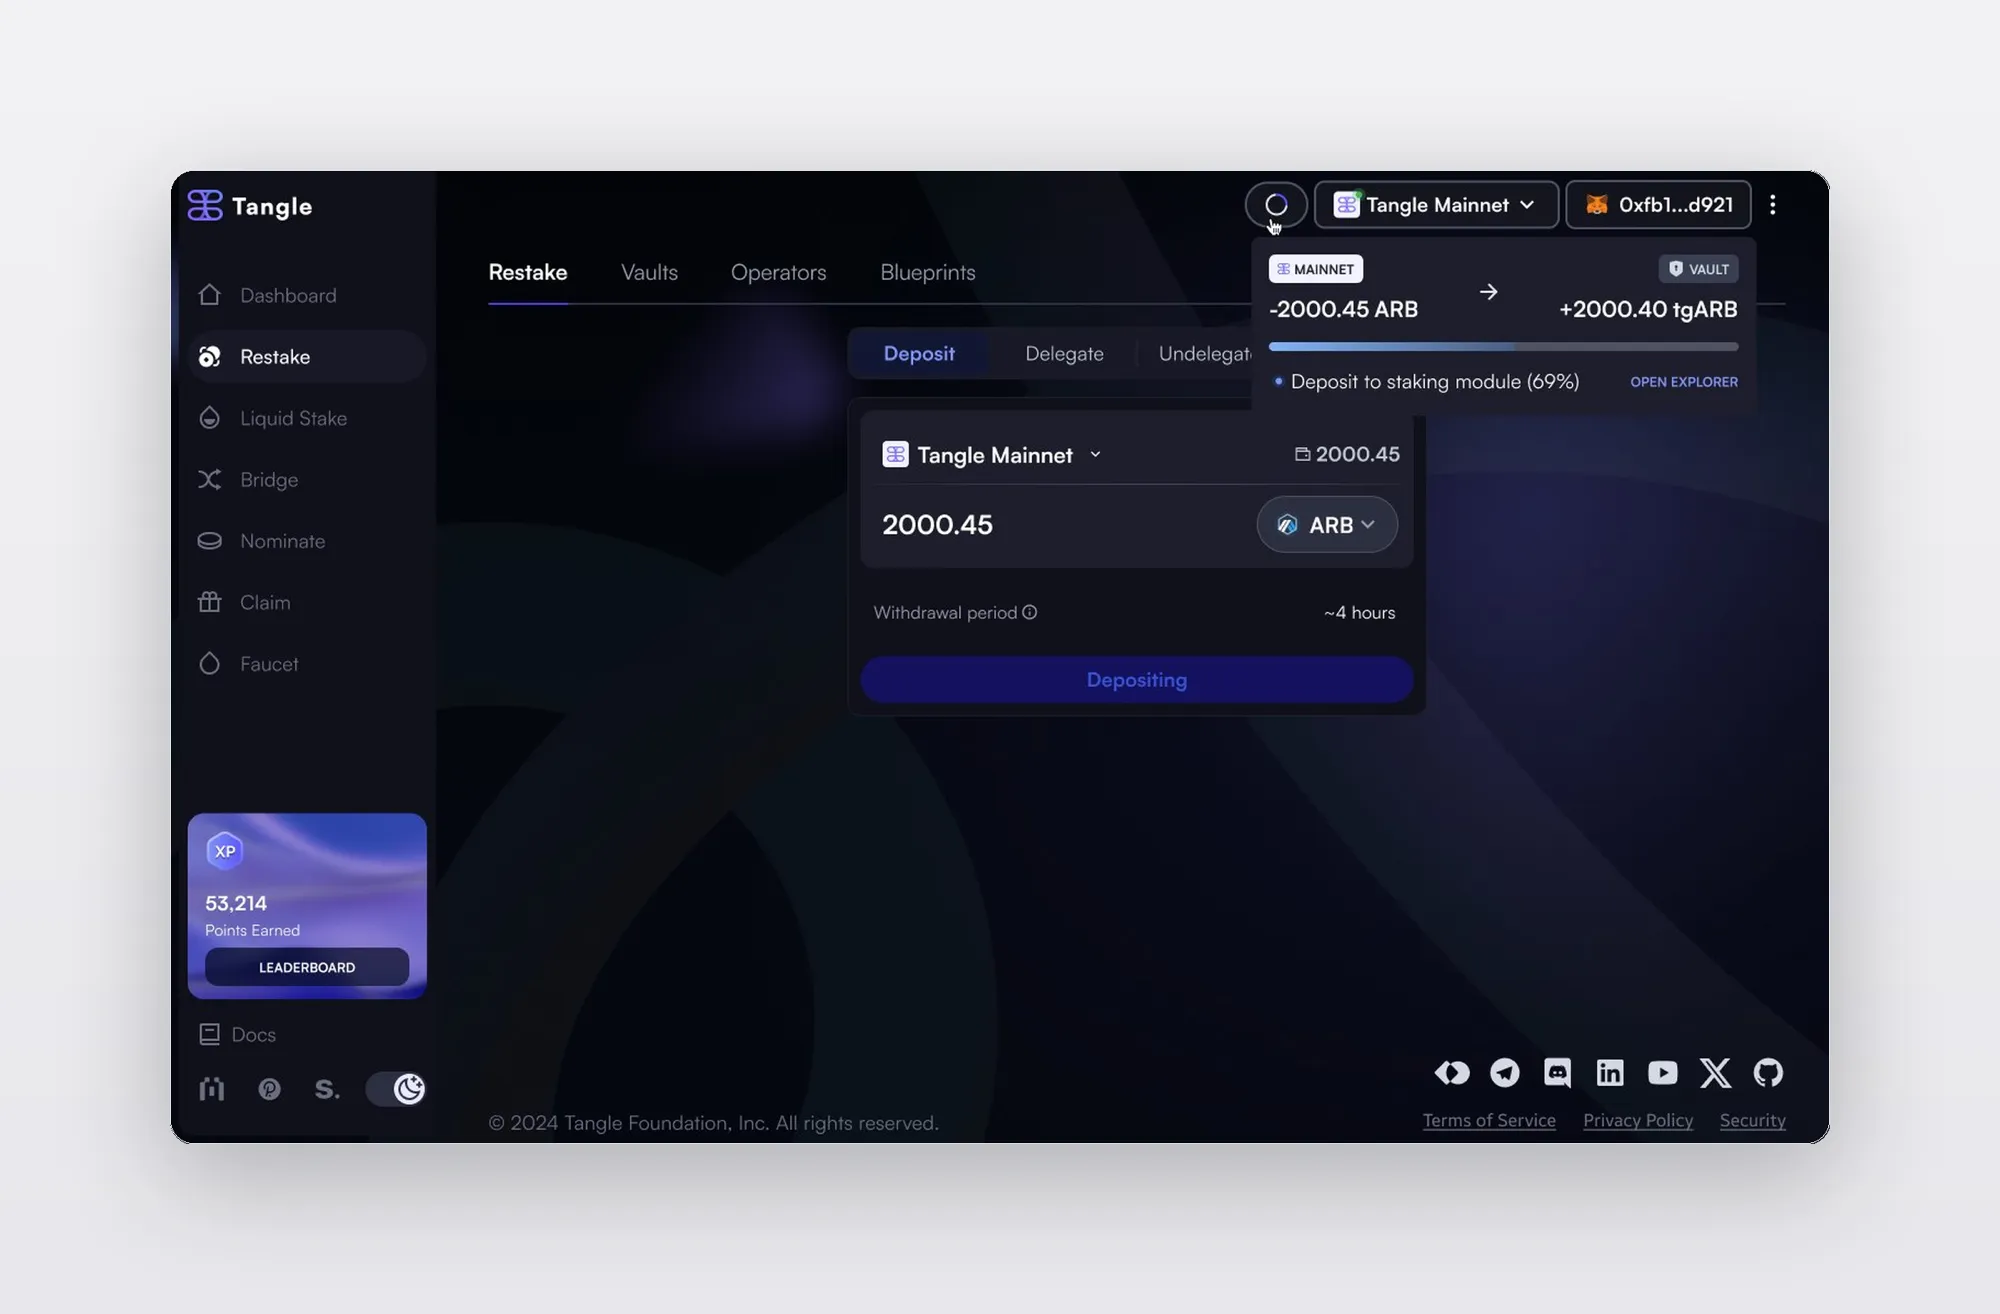
Tangle Restaking Dashboard. Consumer-facing dApp for liquid staking, restaking, and delegation — the economic security layer that underpins the services running on the Cloud Console.
About
Web3 / DeFi / Staking / Consumer
Users
Token holders, delegators, restakers
Tools
Figma
Role
Design Lead
Scope
•
Designed the core flows — stake, unstake, restake, parachain selection, APY visibility, and cross-chain transaction progress
•
Structured the overview IA and multi-step transaction flows to make overlapping asset states legible without costly mistakes
•
Usability testing to validate decisions iteratively and catch friction before shipping
2022
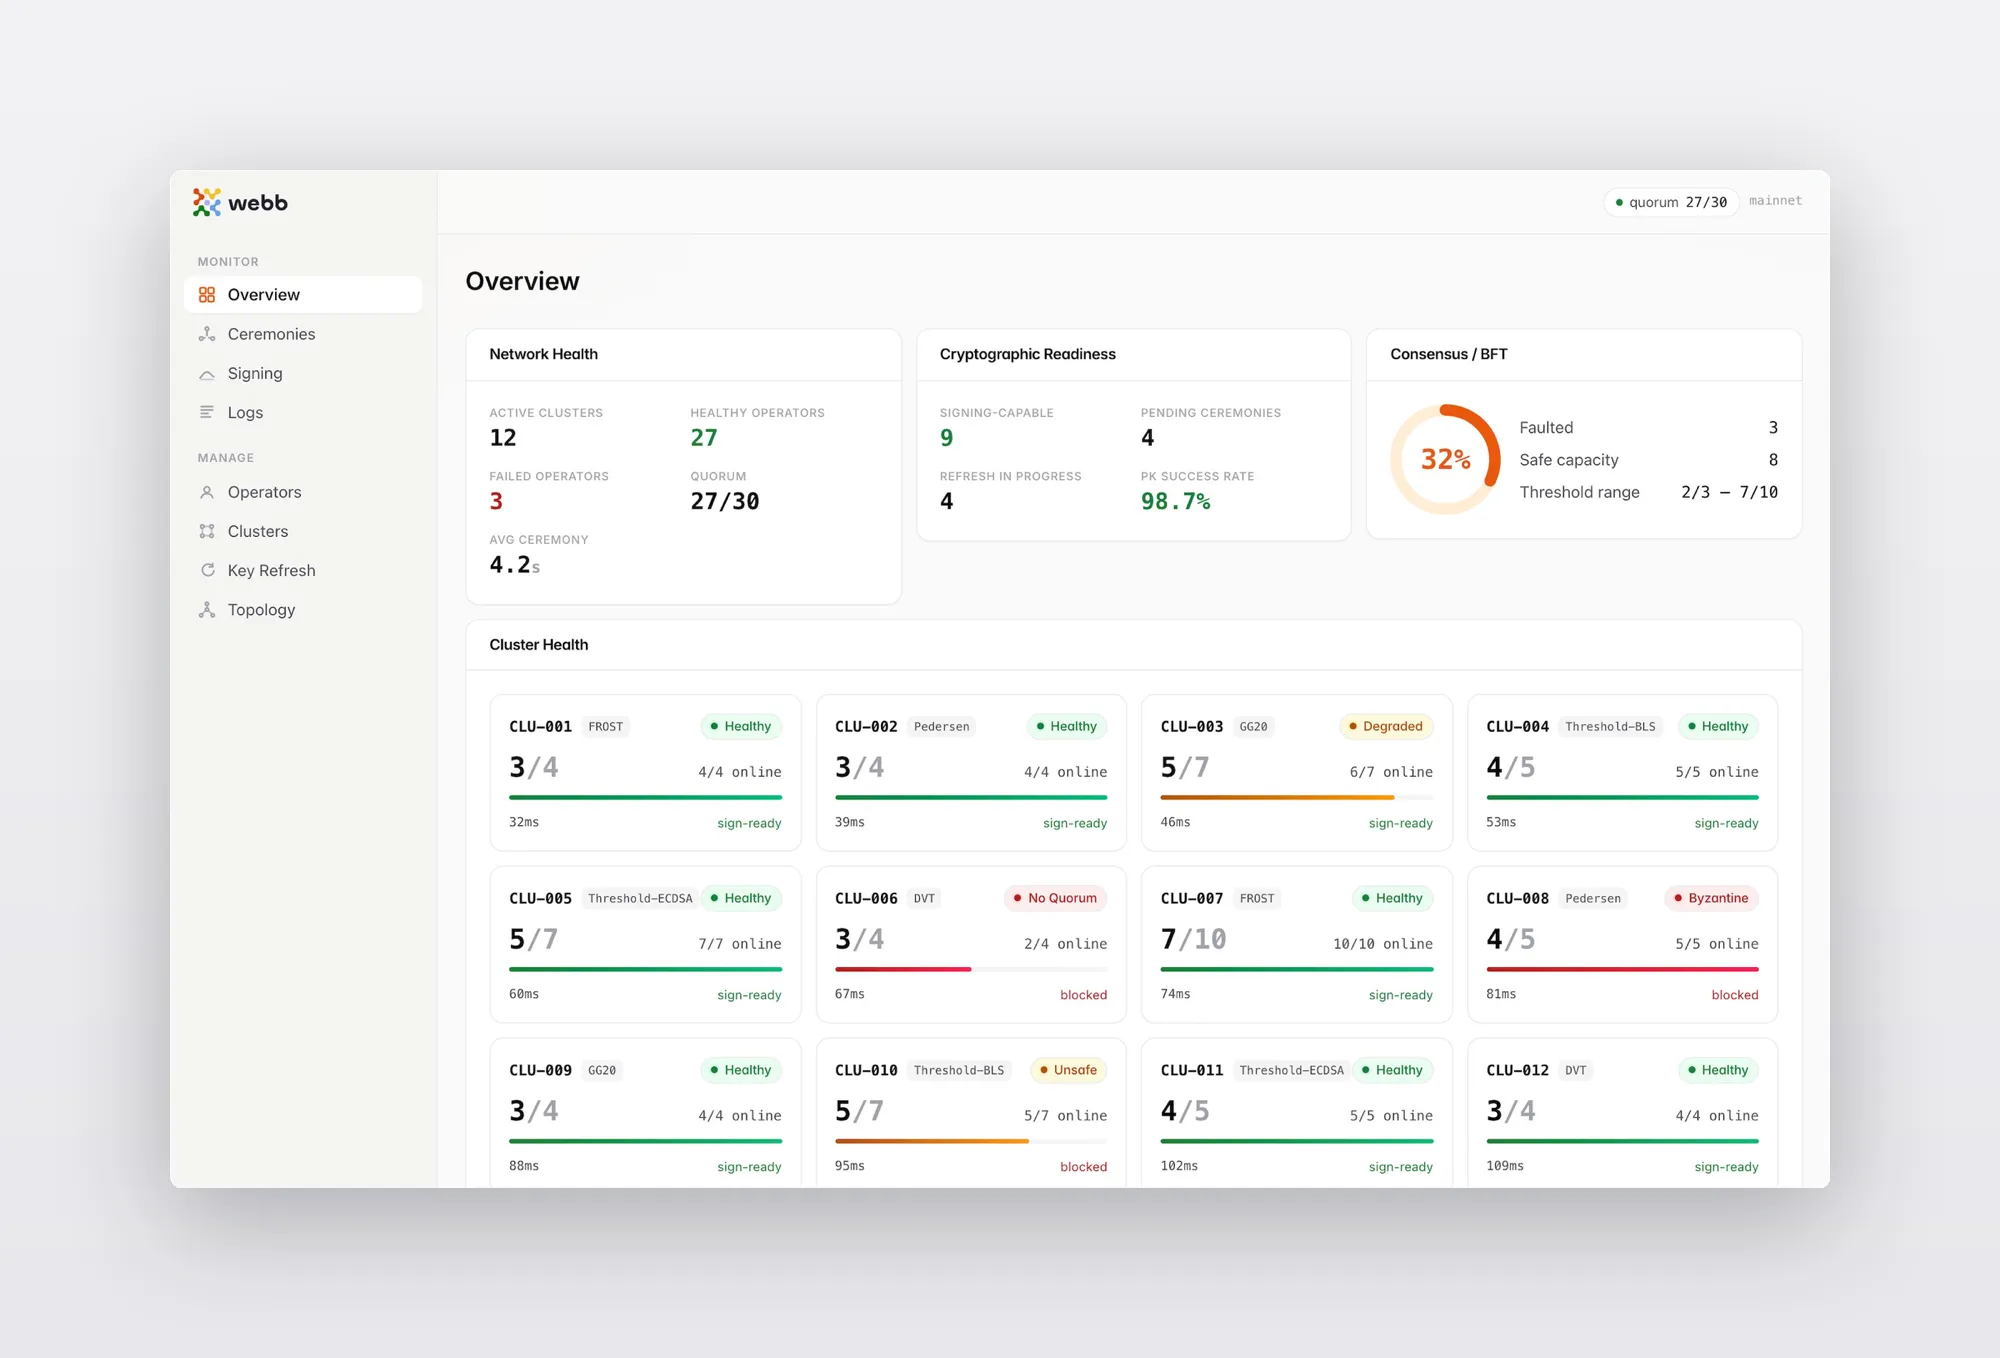
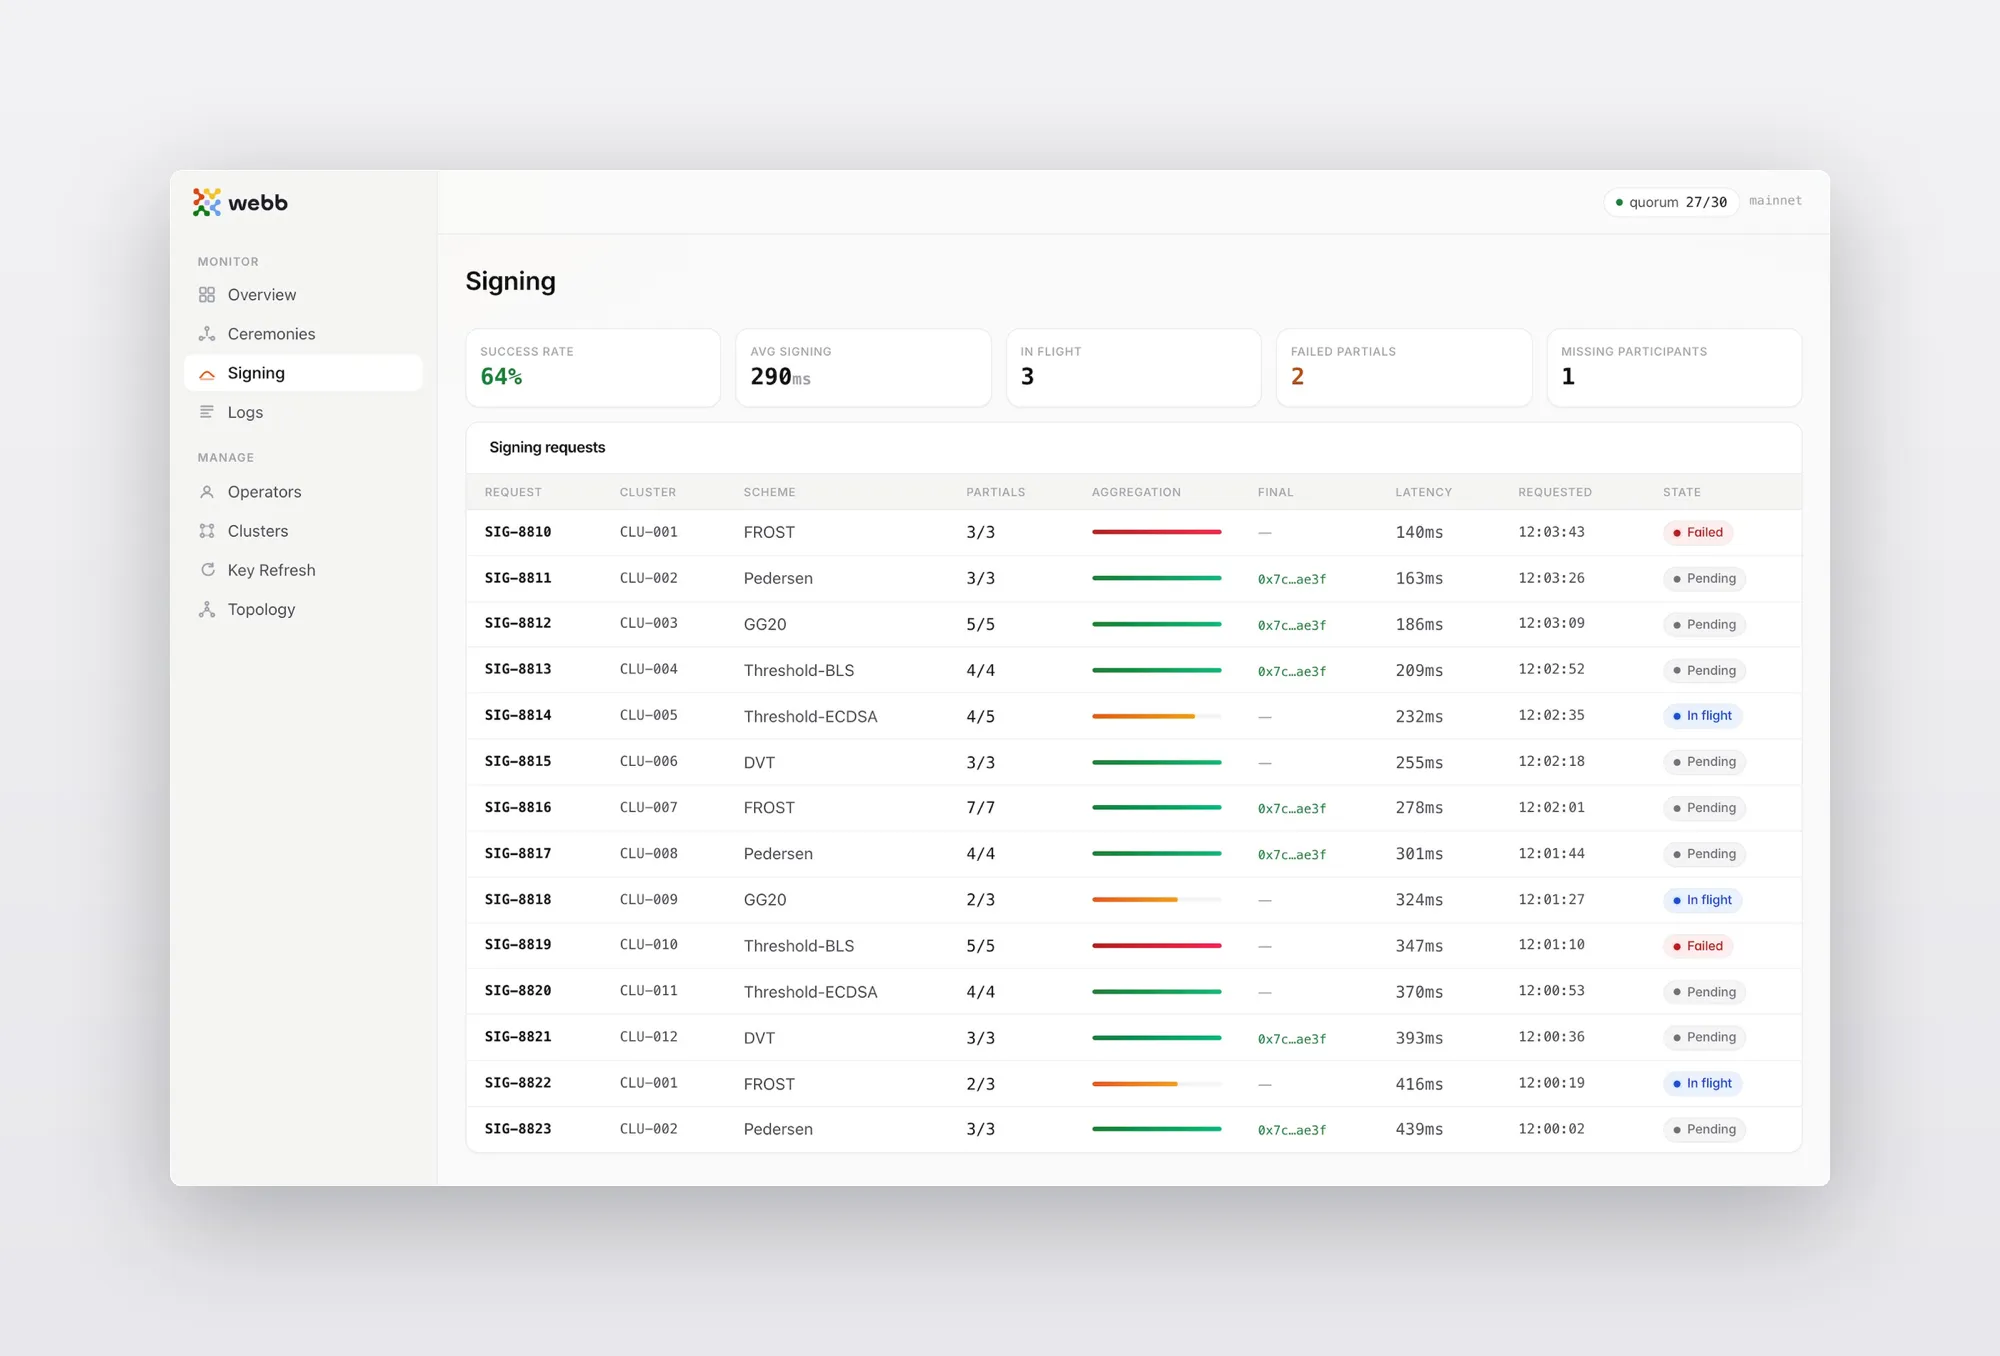
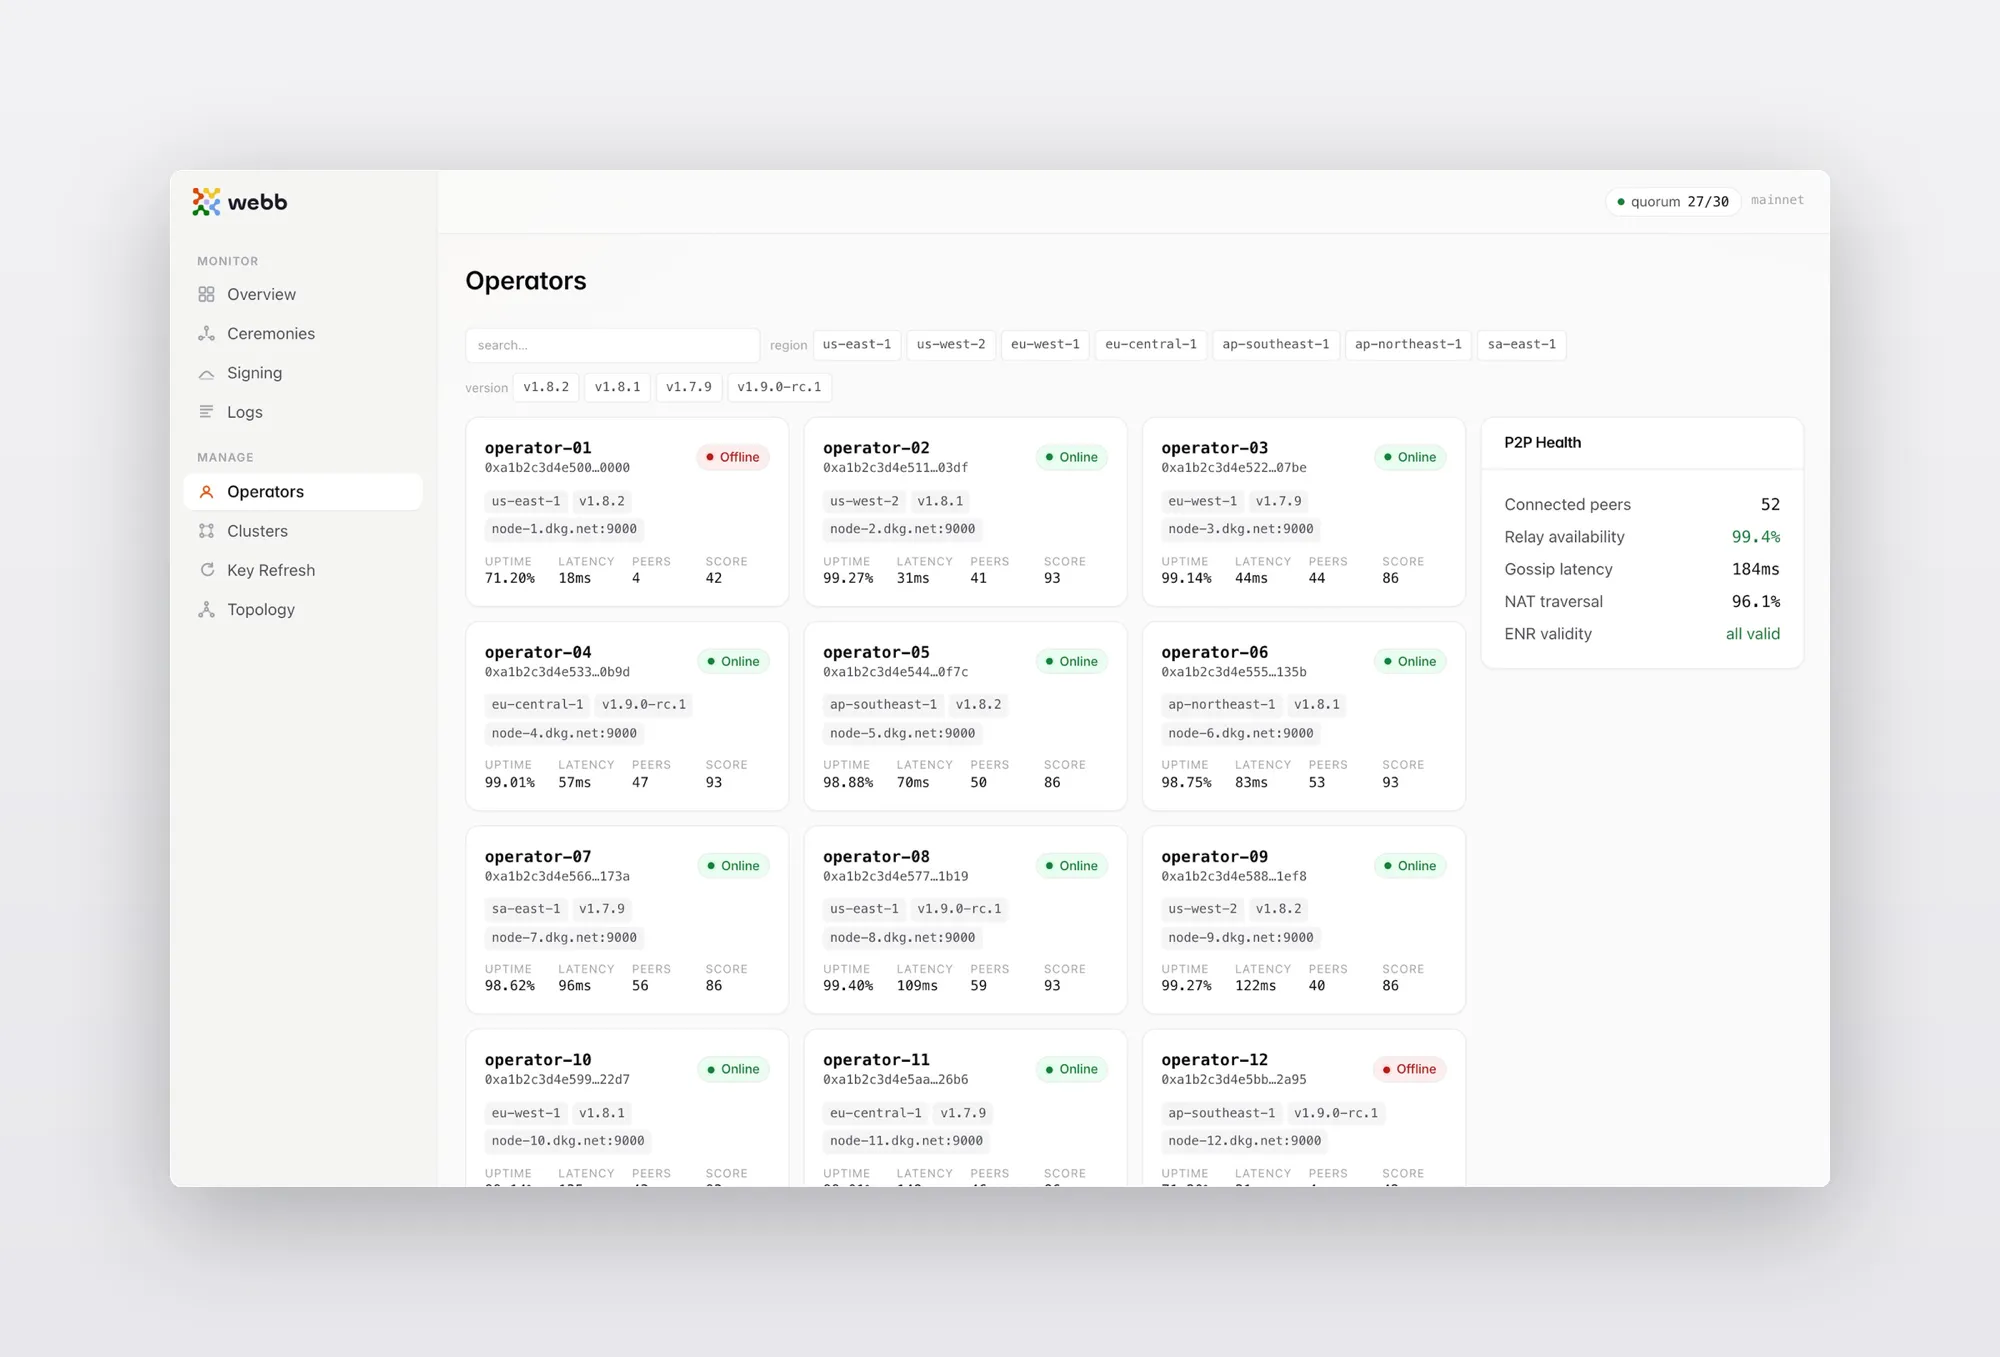
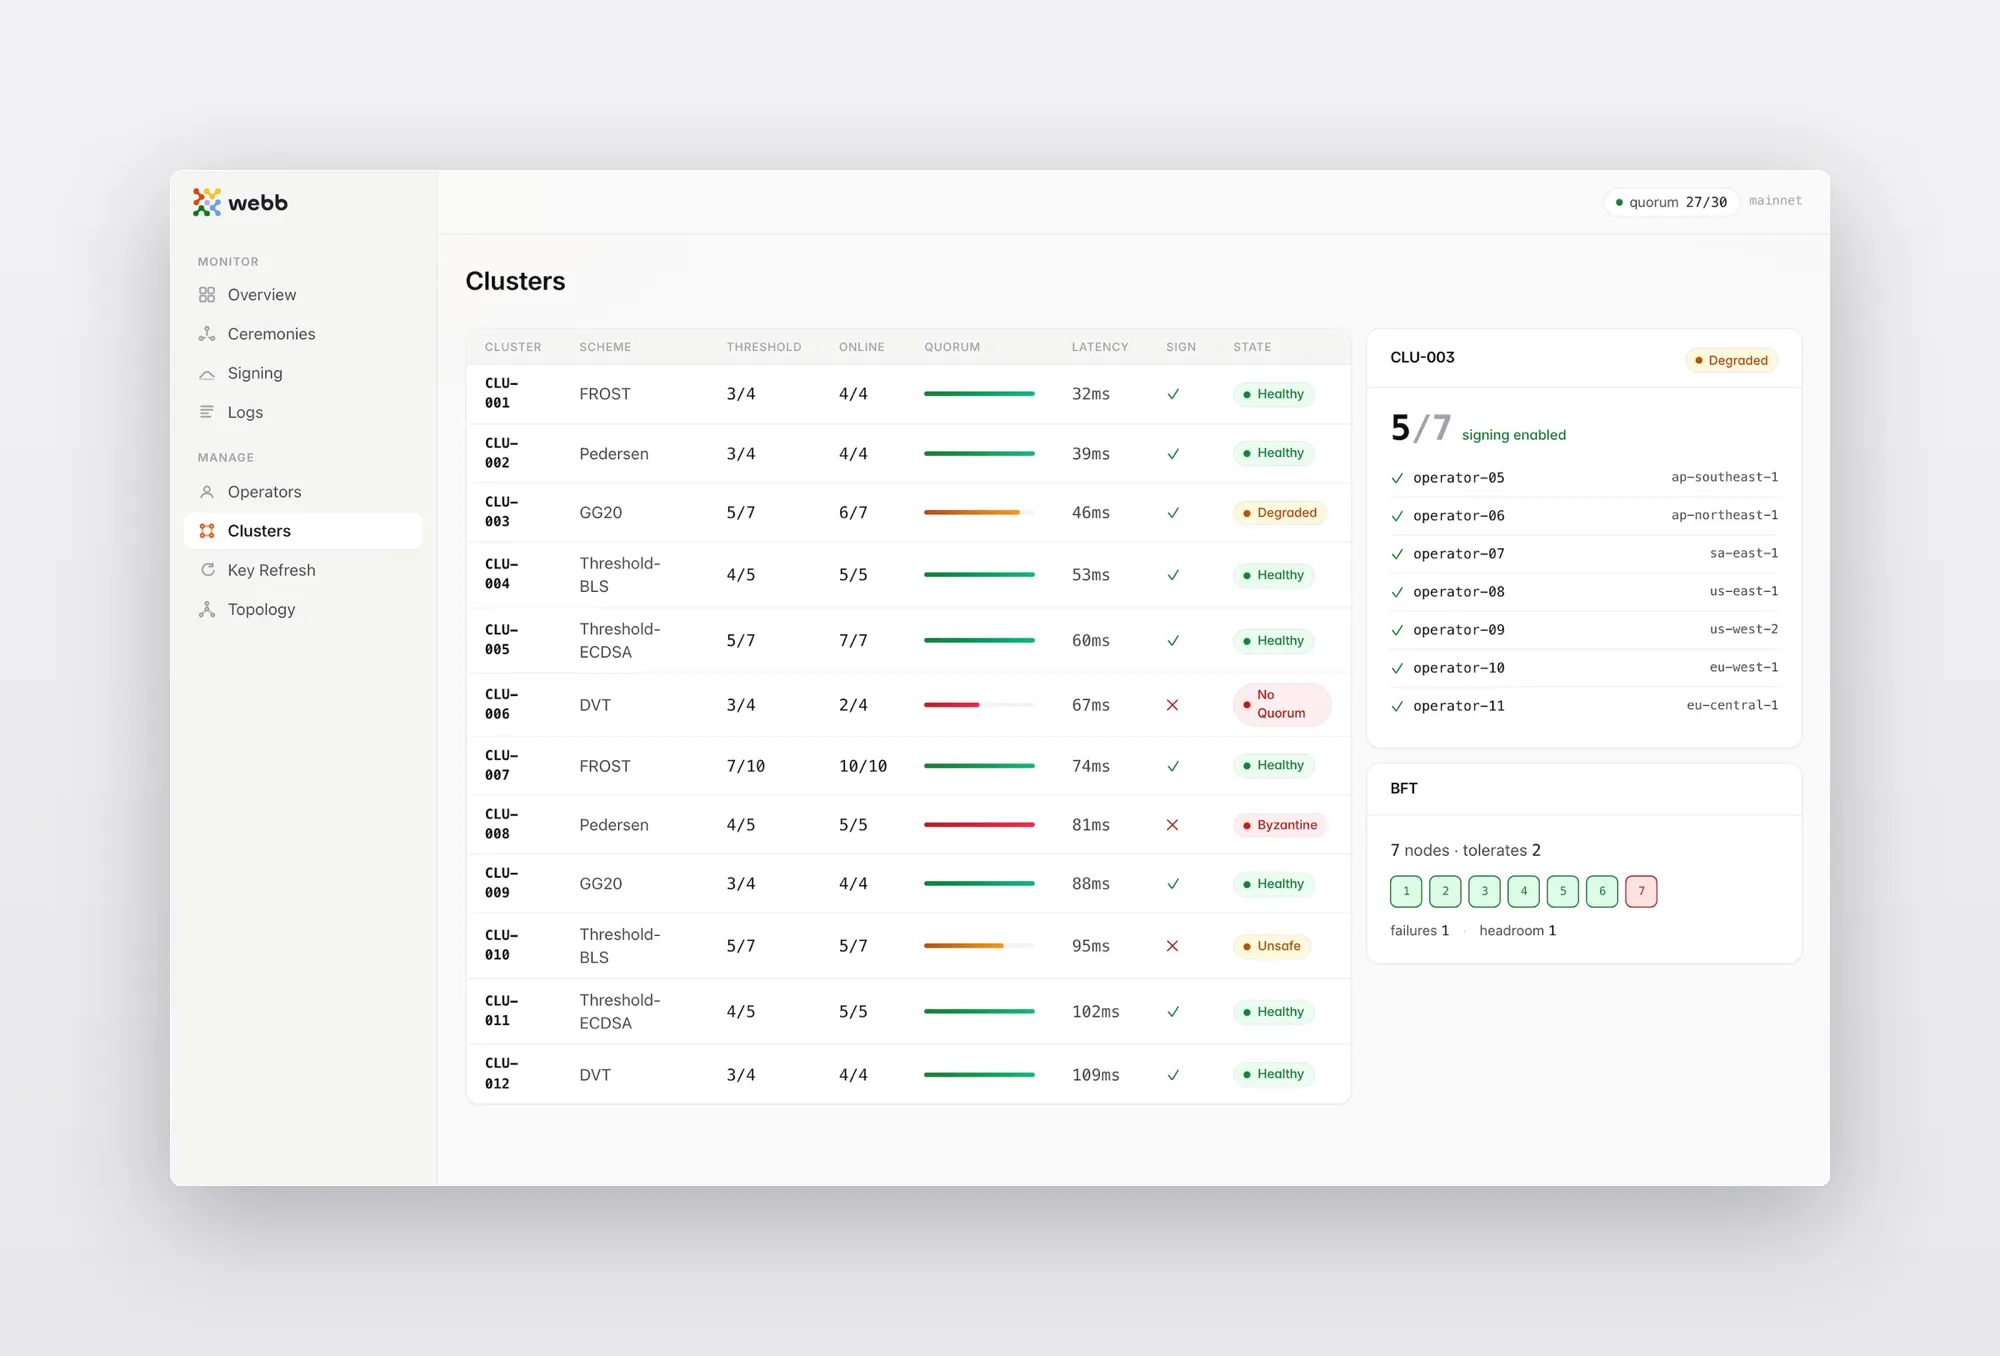
DKG Dashboard. Monitoring interface for the distributed key-generation protocol underpinning Webb's privacy and cross-chain infrastructure.
About
Cryptography / Infrastructure / Monitoring
Role
Product Designer, Webb Technologies
Scope
•
Designed full product 0→1: product vision, UX, brand identity, and web app
•
Translated a dense cryptographic domain into navigable interfaces for node operators and the engineering team
•
Defined key health metrics — quorum status, signing success rate, uptime — through engineering interviews, then structured the dashboard around operational priority